
Blog
2026-05-02
The men's World Cup is coming up, so it's time to work out the cost of filling the official Panini sticker book again.
Panini are boasting that this year's sticker book contains more stickers than ever, which can only mean one thing: you're going to have to buy more stickers than ever.
But how much more than last time is completing this sticker book going to cost you?
Buying stickers
This year, you can buy:
- A starter pack that includes a sticker book with 6 stickers (that are always the same and hence guaranteed to contain no duplicates) and 4 packs of 7 random stickers. This costs £4.99.
- Packs of 7 random stickers. Various sources claim these are £1.25 each, although our local Morrison's is selling them for £2.
- Multipacks of 6 or 8 packs of 7 random stickers. Both these multipacks work out at £1.25 per pack.
- Multipacks of stickers that come with a nice metal box to keep your swaps in (you'll need a few of these if you're planning to complete your collection). These are releasing later than the rest of the collection, but look like they'll work out at £1.25 per pack plus £1 for the metal box.
For the rest of this blog post, we'll assume that all
stickers are bought in multipacks.
)
)
Every album includes Declan Rice (England), Heechan Hwang (South Korea), Alexis Vega (Mexico), Mikel Merino (Spain), Danley Jean Jacques (Haiti) and Nicolas Jackon (Sengal)
How many stickers will I need?
After you've stuck your first 6 stickers in, you need to collect 974 more stickers.
Following the same method as I did in 2018, we can work out that if you want to get all of these from packs of random stickers, then
you should expect to buy 7265 stickers (including the 4 packs in your starter pack). Including the cost of the starter pack, buying all these stickers will cost
£1297.35.
But as always, you don't have to spend this much, as Panini let you order the last \(n\) stickers (for any value of \(n\) that you choose, although I have strong memories
of \(n\) being 50 when we had to send off paper sticker ordering forms when I was at school). On the Panini website, they're selling missing stickers
for 45p per sticker*.
If you decide to order the last 50 stickers, then you should expect to buy 2883 stickers to get the rest of the stickers before ordering the last 50. In total this will
cost you £532.81. That's a big saving.
What is the best number of stickers to order?
If you want to minimise the amount that you have to spend to complete this sticker book, you should choose your value of \(n\) wisely. This plot shows the expected total cost
of completing the sticker book if you decide on different numbers of stickers to order:
)
The lowest expected cost is achieved when ordering 386 stickers: £334.54. That's an even bigger saving, although 386 does feel to me like an unreasonably large value for \(n\).
Swapping
As always, the cheapest way to complete the sticker book is to convince more of your friends to collect too so that you can swap your duplicate stickers with them. You could get
the price down as low as £174.99 if you manage to swap every single duplicate that you get.
If you decide to set \(n\) to 0, there's a good chance that going out now and buying 200 starter packs for £998 to give to your friends make them start collecting will mean spending less money in total
than trying to complete your sticker book on your own...
Edit: The first version of this blog post guessed that the missing stickers would cost 36p each, as this was the cost for other recent collections. The numbers have been updated to match
the 45p that Panini are actually charging. The original lowest cost based on 36p was ordering 483 stickers to give a total cost of £295.78.
(Click on one of these icons to react to this blog post)
You might also enjoy...


Comments
Comments in green were written by me. Comments in blue were not written by me.
Add a Comment
2018-07-07
So you've calculated how much you should expect the World Cup sticker book to cost
and recorded how much it actually cost. You might be wondering what else you can do with your sticker book.
If so, look no further: this post contains 5 mathematical things involvolving your sticker book and stickers.
Test the birthday paradox
)
Stickers 354 and 369: Alisson and Roberto Firmino
In a group of 23 people, there is a more than 50% chance that two of them will share a birthday. This is often called the birthday paradox, as the number 23 is surprisingly small.
Back in 2014 when Alex Bellos suggested testing the birthday paradox on World Cup squads, as there are 23 players in a World Cup squad. I recently discovered that even further back in 2012, James Grime made a video about the birthday paradox in football games, using the players on both teams plus the referee to make 23 people.
In this year's sticker book, each player's date of birth is given above their name, so you can use your sticker book to test it out yourself.
Kaliningrad
)
Sticker 022: Kaliningrad
One of the cities in which games are taking place in this World Cup is Kaliningrad. Before 1945, Kaliningrad was called Königsberg. In Königsburg, there were seven bridges connecting four islands. The arrangement of these bridges is shown below.
)
The people of Königsburg would try to walk around the city in a route that crossed each bridge exactly one. If you've not tried this puzzle before, try to find such a route now before reading on...
In 1736, mathematician Leonhard Euler proved that it is in fact impossible to find such a route. He realised that for such a route to exist, you need to be able to pair up the bridges on each island so that you can enter the island on one of each pair and leave on the other. The islands in Königsburg all have an odd number of bridges, so there cannot be a route crossing each bridge only once.
In Kaliningrad, however, there are eight bridges: two of the original bridges were destroyed during World War II, and three more have been built. Because of this, it's now possible to walk around the city crossing each bridge exactly once.
)
A route around Kaliningrad crossing each bridge exactly once.
I wrote more about this puzzle, and using similar ideas to find the shortest possible route to complete a level of Pac-Man, in this blog post.
Sorting algorithms
If you didn't convince many of your friends to join you in collecting stickers, you'll have lots of swaps. You can use these to practice performing your favourite sorting algorithms.
Bubble sort
In the bubble sort, you work from left to right comparing pairs of stickers. If the stickers are in the wrong order, you swap them. After a few passes along the line of stickers, they will be in order.
)
Bubble sort
Insertion sort
In the insertion sort, you take the next sticker in the line and insert it into its correct position in the list.
)
Insertion sort
Quick sort
In the quick sort, you pick the middle sticker of the group and put the other stickers on the correct side of it. You then repeat the process with the smaller groups of stickers you have just formed.
)
Quick sort
The football
)
Sticker 007: The official ball
Sticker 007 shows the official tournament ball. If you look closely (click to enlarge), you can see that the ball is made of a mixture of pentagons and hexagons. The ball is not made of only hexagons, as road signs in the UK show.
Stand up mathematician Matt Parker started a petition to get the symbol on the signs changed, but the idea was rejected.
If you have a swap of sticker 007, why not stick it to a letter to your MP about the incorrect signs as an example of what an actual football looks like.
Psychic pets
Speaking of Matt Parker, during this World Cup, he's looking for psychic pets that are able to predict World Cup results. Why not use your swaps to label two pieces of food that your pet can choose between to predict the results of the remaining matches?
)
)
Timber using my swaps to wrongly predict the first match
(Click on one of these icons to react to this blog post)
You might also enjoy...

Comments
Comments in green were written by me. Comments in blue were not written by me.
@Matthew: Thank you for the calculations. Good job I ordered the stickers I wanted #IRN. 2453 stickers - that's more than the number you bought (1781) to collect all stickers!
Milad
@Matthew: Here is how I calculated it:
You want a specific set of 20 stickers. Imagine you have already \(n\) of these. The probability that the next sticker you buy is one that you want is
$$\frac{20-n}{682}.$$
The probability that the second sticker you buy is the next new sticker is
$$\mathbb{P}(\text{next sticker is not wanted})\times\mathbb{P}(\text{sticker after next is wanted})$$
$$=\frac{662+n}{682}\times\frac{20-n}{682}.$$
Following the same method, we can see that the probability that the \(i\)th sticker you buy is the next wanted sticker is
$$\left(\frac{662+n}{682}\right)^{i-1}\times\frac{20-n}{682}.$$
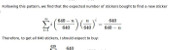
Using this, we can calculate the expected number of stickers you will need to buy until you find the next wanted one:
$$\sum_{i=1}^{\infty}i \left(\frac{20-n}{682}\right) \left(\frac{662+n}{682}\right)^{i-1} = \frac{682}{20-n}$$
Therefore, to get all 682 stickers, you should expect to buy
$$\sum_{n=0}^{19}\frac{682}{20-n} = 2453 \text{ stickers}.$$
You want a specific set of 20 stickers. Imagine you have already \(n\) of these. The probability that the next sticker you buy is one that you want is
$$\frac{20-n}{682}.$$
The probability that the second sticker you buy is the next new sticker is
$$\mathbb{P}(\text{next sticker is not wanted})\times\mathbb{P}(\text{sticker after next is wanted})$$
$$=\frac{662+n}{682}\times\frac{20-n}{682}.$$
Following the same method, we can see that the probability that the \(i\)th sticker you buy is the next wanted sticker is
$$\left(\frac{662+n}{682}\right)^{i-1}\times\frac{20-n}{682}.$$
Using this, we can calculate the expected number of stickers you will need to buy until you find the next wanted one:
$$\sum_{i=1}^{\infty}i \left(\frac{20-n}{682}\right) \left(\frac{662+n}{682}\right)^{i-1} = \frac{682}{20-n}$$
Therefore, to get all 682 stickers, you should expect to buy
$$\sum_{n=0}^{19}\frac{682}{20-n} = 2453 \text{ stickers}.$$
Matthew
@Matthew: Yes, I would like to know how you work it out please. I believe I have left my email address in my comment. It seems like a lot of stickers if you are just interested in one team.
Milad
@Milad: Following a similiar method to this blog post, I reckon you'd expect to buy 2453 stickers (491 packs) to get a fixed set of 20 stickers. Drop me an email if you want me to explain how I worked this out.
Matthew
Thanks for the maths, but I have one probability question. How many packs would I have to buy, on average, to obtain a fixed set of 20 stickers?
Milad
Add a Comment
2018-06-16
This year, like every World Cup year, I've been collecting stickers to fill the official Panini World Cup sticker album.
Back in March, I calculated that I should expect it to cost £268.99 to fill this year's album (if I order the last 50 stickers).
As of 6pm yesterday, I need 47 stickers to complete the album (and have placed an order on the Panini website for these).
So... How much did it cost?
In total, I have bought 1781 stickers (including the 47 I ordered) at a cost of £275.93. The plot below shows
the money spent against the number of stickers stuck in, compared with the what I predicted in March.
)
To create this plot, I've been keeping track of exactly which stickers were in each pack I bought. Using this data, we can
look for a few more things. If you want to play with the data yourself, there's a link at the bottom to download it.
Swaps
The bar chart below shows the number of copies of each sticker I got (excluding the 47 that I ordered). Unsurprisingly, it looks a lot like
random noise.
)
The sticker I got most copies of was sticker 545, showing Panana player Armando Cooper.
)
Armando Cooper on sticker 545
I got swaps of 513 different stickers, meaning I'm only 169 stickers short of filling a second album.
First pack of all swaps
Everyone who has every done a sticker book will remember the awful feeling you get when you first get a pack of all swaps.
For me, the first time this happened was the 50th pack. The plot below shows when the first pack of all swaps occurred in 500,000 simulations.
)
Looks like I was really quite unlucky to get a pack of all swaps so soon.
Duplicates in a pack
In all the 345 packs that I bought, there wasn't a single pack that contained two copies of the same sticker.
In fact, I don't remember ever getting two of the same sticker in a pack. For a while I've been wondering if this is because Panini
ensure that packs don't contain duplicates, or if it's simply very unlikely that they do.
If it was down to unlikeliness, the probability of having no duplicates in one pack would be:
\begin{align}
\mathbb{P}(\text{no duplicates in a pack}) &= 1 \times\frac{681}{682}\times\frac{680}{682}\times\frac{679}{682}\times\frac{678}{682}\\
&= 0.985
\end{align}
and the probability of none of my 345 containing a duplicate would be:
\begin{align}
\mathbb{P}(\text{no duplicates in 345 packs})
&= 0.985^{345}\\
&= 0.00628
\end{align}
This is very very small, so it's safe to conclude that Panini do indeed ensure that packs do not contain duplicates.
The data
If you'd like to have a play with the data yourself, you can download it here. Let me know if
you do anything with it...
(Click on one of these icons to react to this blog post)
You might also enjoy...
Comments
Comments in green were written by me. Comments in blue were not written by me.
Add a Comment
2018-05-02
Every morning just before 7am, one of the Today Programme's presenters reads out a puzzle. Yesterday, it was this puzzle:

In a given month, the probability of a certain daily paper either running a story about inappropriate behaviour at a party conference or running one about somebody's pet being retrieved from a domestic appliance is exactly half the probability of the same paper containing a photo of a Tory MP jogging. The probability of no such photo appearing is the same as that of there being a story about inappropriate behaviour at a party conference. The probability of the paper running a story about somebody's pet being retrieved from a domestic appliance is a quarter that of its containing a photo of a Tory MP jogging. What are the probabilities the paper will (a) run the conference story, (b) run the pet story, (c) contain the jogging photo?

I'm not the only one to notice that some of Radio 4's daily puzzles are not great.
I think this puzzle is a great example of a terrible puzzle. You can already see the first problem with it: it's long and wordy and very hard to follow on the radio.
But maybe this isn't so important, as you can
read it here after it's been read out.
Once you've done this, you can re-write the puzzle as follows:
there are three news stories (\(A\), \(B\) and \(C\)) that the newspaper might publish in a month. We are given the following information:
$$\mathbb{P}(A\text{ or }B)=\tfrac12\mathbb{P}(C)$$
$$1-\mathbb{P}(C)=\mathbb{P}(A)$$
$$\mathbb{P}(B)=\tfrac14\mathbb{P}(C)$$
To solve this puzzle, we need use the formula \(\mathbb{P}(A\text{ or }B)=\mathbb{P}(A)+\mathbb{P}(B)-\mathbb{P}(A\text{ and }B)\).
These Venn diagrams justify this formula:
)
Venn diagrams showing that \(\mathbb{P}(A\text{ or }B)=\mathbb{P}(A)+\mathbb{P}(B)-\mathbb{P}(A\text{ and }B)\).
Using the information we were given in the question, we get:
\begin{align}
\tfrac12\mathbb{P}(C)&=\mathbb{P}(A\text{ or }B)\\
&=1-\mathbb{P}(C)+\tfrac14\mathbb{P}(C)-\mathbb{P}(A\text{ and }B)\\
\mathbb{P}(C)&=\tfrac45(1-\mathbb{P}(A\text{ and }B)).
\end{align}
At this point we have reached the second problem with this puzzle: there's no answer unless we make some extra assumptions, and the question doesn't make it clear what we can assume.
But let's give the puzzle the benefit of the doubt and try some assumptions.
Assumption 1: The events are mutually exclusive
If we assume that the events \(A\) and \(B\) are mutually exclusive—or, in other words, only one of these two articles can be published,
perhaps due to a lack of space—then we can use the fact that
$$\mathbb{P}(A\text{ and }B)=0.$$
This means that
\(\mathbb{P}(C)=\tfrac45\),
\(\mathbb{P}(A)=\tfrac15\), and
\(\mathbb{P}(B)=\tfrac15\). There's a problem with this answer, though: the three probabilities add up to more than 1.
This wouldn't be a problem, except we assumed that only one of the articles \(A\) and \(B\) could be published.
The probabilities adding up to more than 1 means that either \(A\) and \(C\) are not mutually exclusive or \(A\) and \(B\) are not mutually exclusive,
so \(C\) could be published alongside \(A\) or \(B\). There seems to be nothing special about the three news stories to mean that only some combinations
could be published together, so at this point I figured that this assumption was wrong and moved on.
Today, however, the answer was posted, and
this answer was given (without any working out). So we have a third problem with this puzzle: the answer that was given is wrong, or at the very best
is based on questionable assumptions.
Assumption 2: The events are independent
If we assume that the events are independent—so one article being published doesn't affect whether or not another is published—then
we may use the fact that
$$\mathbb{P}(A\text{ and }B)=\mathbb{P}(A)\mathbb{P}(B).$$
If we let \(c=\mathbb{P}(C)\), then we get:
\begin{align}
\tfrac12c&=\mathbb{P}(A)+\mathbb{P}(B)-\mathbb{P}(A\text{ and }B)\\
&=\mathbb{P}(A)+\mathbb{P}(B)-\mathbb{P}(A)\mathbb{P}(B)\\
&=1-c+\tfrac14c-\tfrac14(1-c)c\\
\tfrac14c^2-\tfrac32c+1&=0.
\end{align}
You can use your favourite formula to solve this to find that \(c=3-\sqrt5\), and therefore
\(\mathbb{P}(A)=\sqrt5-2\) and
\(\mathbb{P}(B)=\tfrac34-\tfrac{\sqrt5}4\).
In this case, our assumption appears to be more reasonable—as over the course of a month the stories published by a paper probably don't have
much of an effect on each other—but we have the fourth, and probably biggest problem with the puzzle: the question and answer are not interesting or surprising, and
the method is a bit tedious.
(Click on one of these icons to react to this blog post)
You might also enjoy...
Comments
Comments in green were written by me. Comments in blue were not written by me.
@Stefan: It's possible that that was intended but it's not completely clear. If that was the intention, I stick to my point that it's odd that the other story can be published alongside these two.
Matthew
Doesn’t the word ‘either’ in the opening phrase make A and B explicity exclusive?
Stefan
Add a Comment
2018-03-23
This morning, I heard about Arnie Ellis on the Today programme. Arnie is the first baby boy to be born in his family in five generations, following ten girls. According to John Humphrys, there is a 20,000-to-1 chance of this happening. Pretty quickly, I started wondering where this number came from.
After a quick Google, I found that this news story had appeared in many of today's papers, including the Sun and the Daily Mail. They all featured this 20,000-to-1 figure, which according to The Sun originally came from Ladbrokes.
What is the chance of this happening?
If someone is having a child, the probability of it being a girl is 0.5. The probability of it being a boy is also 0.5. So the probaility of having ten girls followed by a boy is
$$\left(\tfrac12\right)^{10}\times\tfrac12=\frac1{2048}.$$
If all 11 children were siblings, then this would be the chance of this happening—and it's a long way off the 20,000-to-1. But in Arnie's case, the situation is different. Luckily in the Daily Mail article, there is an outline of Arnie's family tree.
)
Here, you can see that the ten girls are spread over five generations. So the question becomes: given a baby, what is the probability that the child is male and his most recently born ten relatives on their mother's side are all female?
Four of the ten relatives are certainly female—Arnie's mother, grandmother, great grandmother and great great grandmother are all definitely female. This only leaves six more relatives, so the probability of a baby being in Arnie's position is
$$\left(\tfrac12\right)^{6}\times\tfrac12=\frac1{128}.$$
This is now an awful lot lower than the 20,000-to-1 we were told. In fact, with around 700,000 births in the UK each year, we'd expect over 5,000 babies to be born in this situation every year. Maybe Arnie's not so rare after all.
This number is based on the assumption that the baby's last ten relatives are spread across five generations. But the probability will be different if the relatives are spread over a different number of generations. Calculating the probability for a baby with any arrangement of ancestors would require knowing the likelihood of each arrangement of relatives, which would require a lot of data that probably doesn't exist. But the actual anwer is probably not too far from 127-to-1.
Where did 20,000-to-1 come from?
This morning, I emailed Ladbrokes to see if they could shed any light on the 20,000-to-1 figure. They haven't got back to me yet. (Although they did accidentally CC me when sending the query on to someone who might know the answer, so I'm hopeful.) I'll update this post with an explanaation if I do hear back.
Until then, there is one possible explanation for the figure: we have looked at the probability that a baby will be in this situation, but we could instead have started at the top of the family tree and looked at the probability that Beryl's next ten decendents were girls followed by a boy. The probability of this happening will be lower, as there is a reasonable chance that Beryl could have no female children, or no children at all. Looking at the problem this way, there are more ways for the situation to not happen, so the probability of it happening is lower.
But working the actually probability out in this way would again require data about how many children are likely in each generation, and would be a complicated calculation. It seems unlikely that this is what Ladbrokes did. Let's hope they shed some light on it...
(Click on one of these icons to react to this blog post)
You might also enjoy...

Comments
Comments in green were written by me. Comments in blue were not written by me.
Add a Comment