
Blog
2018-03-22
Back in 2014, I worked out the cost of filling an official Panini World Cup 2014 sticker book. Today, the 2018 sticker book was relased: compared to four years ago, there are more stickers to collect and the prices have all changed. So how much should we expect it to cost us to fill the album this time round?
How many stickers will I need?
There are 682 stickers to collect. Imagine you have already stuck \(n\) stickers into your album. The probability that the next sticker you buy is new is
$$\frac{682-n}{682}.$$
The probability that the second sticker you buy is the next new sticker is
$$\mathbb{P}(\text{next sticker is not new})\times\mathbb{P}(\text{sticker after next is new})$$
$$=\frac{n}{682}\times\frac{682-n}{682}.$$
Following the same method, we can see that the probability that the \(i\)th sticker you buy is the next new sticker is
$$\left(\frac{n}{682}\right)^{i-1}\times\frac{682-n}{682}.$$
Using this, we can calculate the expected number of stickers you will need to buy until you find a new one:
$$\sum_{i=1}^{\infty}i \left(\frac{682-n}{682}\right) \left(\frac{n}{682}\right)^{i-1} = \frac{682}{682-n}$$
Therefore, to get all 682 stickers, you should expect to buy
$$\sum_{n=0}^{681}\frac{682}{682-n} = 4844 \text{ stickers}.$$
How much will this cost?
You can buy the following [source]:
- Starter pack (an album and 31 stickers) for £3.99
- Sticker packs (5 stickers) for 80p
- Sticker multipacks (30 stickers) for £4.50
First of all you'll need to buy the starter pack, as you need an album to stick everything in. This comes with 31 stickers; we should expect to buy 4813 more stickers after this.
The cheapest way to buy these stickers is to buy them in multipacks for 15p per sticker. This gives a total expected cost of filling the sticker album of £725.94. (Although if your local newsagent doesn't stock the multipacks, buying 80p packs to get these stickers will cost you £774.07.)
What if I order the last 50 stickers?
If you'd like to spend a bit less on the sticker book, Panini lets you order the last 50 stickers to complete your album. This is very helpful as these last 50 stickers are the most expensive.
You can order missing stickers from the Panini website for 22p per sticker's sticker ordering service for the 2018 World Cup doesn't appear to be online yet; but based on other recent collections, it looks like ordered stickers will cost 16p each, with £1 postage per order.
Ordering the last 50 stickers reduces the expected number of other stickers you need to buy to
$$\sum_{n=0}^{631}\frac{682}{682-n} = 1775 \text{ stickers}.$$
This reduces the expected overall cost to £291.03. So I've just saved you £434.91.
What if I order more stickers?
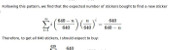
Of course, if you're willing to completely give up on your morals, you could order more than one batch of 50 stickers from Panini. This raises the question: how many should you order to minimise the expected cost.
If you order the last \(a\) stickers, then you should expect to pay:
- £3.99 for the album and first 31 stickers
- £\(\displaystyle0.15\left(\sum_{n=1}^{681-a}\frac{682}{682-n}-31\right)\) for other stickers you need
- £\(\displaystyle \left(0.16a+\left\lceil \frac{a}{50}\right\rceil\right)\) to order the last \(a\) stickers
The total expected cost of filling your album for different values of \(a\) is shown in the graph below.
)
The red cross shows the point at which the album is cheapest: this is when the last 550 stickers are ordered, giving a total expected cost of £120.18. That's another £170.85 I've saved you. You're welcome.
Still, ordering nearly all stickers to minimise the cost doesn't sound like the most fun way to complete the sticker book, so you probably need to order a few less than this to maximise your fun.
What about swaps?
Of course, you can also get the cost of filling the book down by swapping your spare stickers with friends. In 2016, I had a go at simulating filling a sticker book with swapping and came to the possibly obvious conclusion that the more friends you have to swap with, the cheaper filling the book will become.
My best advice for you, therefore, is to get out there right now and start convinding your friends to join you in collecting stickers.
(Click on one of these icons to react to this blog post)
You might also enjoy...


Comments
Comments in green were written by me. Comments in blue were not written by me.
Helpful article!! My head always go into a spine with probability, but does the fact that you would not get a double within a pack affect the overall strategy or cost? My head says this is an another advantage of buying 30 packs over the 5.
RM
Add a Comment
2017-03-27
Tomorrow, the new 12-sided one pound coin is released.
)
Although I'm excited about meeting this new coin, I am also a little sad,
as its release ends the era in which all British coins are shapes of constant
width.
Shapes of constant width
A shape of constant width is a shape that is the same width in every direction,
so these shapes can roll without changing height. The most obvious such shape
is a circle. But there are others, including the shape of the seven-sided 50p
coin.
)
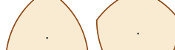
As shown below, each side of a 50p is part of a circle centred around the opposite corner.
As a 50p rolls, its height is always the distance between one of the corners and
the side opposite, or in other words the radius of this circle. As these circles
are all the same size, the 50p is a shape of constant width.
)
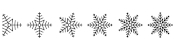
Shapes of constant width can be created from any regular polygon with an
odd number of sides, by replacing the sides by parts of circles centred at the
opposite corner. The first few are shown below.
)
It's also possible to create shapes of constant width from irregular polygons with an odd number,
but it's not possible to create them from polygons with an even number of sides.
Therefore, the new 12-sided pound coin will be the first non-constant width British coin since
the (also 12-sided) threepenny bit was phased out in 1971.
Back in 2014, I wrote to my MP in an attempt to find
out why the new coin was not of a constant width. He forwarded my letter to
the Treasury, but I never heard back from them.
Pizza cutting
When cutting a pizza into equal shaped pieces, the usual approach is to
cut along a few diameters to make triangles. There are other ways to fairly
share pizza, including the following (that has appeared here before as an answer to this puzzle):
)
The slices in this solution are closely related to a triangle of constant
width. Solutions can be made using other shapes of constant width,
including the following, made using a constant width pentagon and heptagon (50p):
)
)
There are many more ways to cut a pizza into equal pieces. You can find them in Infinite families of monohedral disk tilings by Joel Haddley and Stephen Worsley [1].
You can't use the shape of a new pound coin to cut a pizza though.
Edit: Speaking of new £1 coins, I made this stupid video with Adam "Frownsend" Townsend about them earlier today:
References
[1] Infinite families of monohedral disk tilings by Joel Haddley and Stephen Worsley. December 2015. [link]
(Click on one of these icons to react to this blog post)
You might also enjoy...

Comments
Comments in green were written by me. Comments in blue were not written by me.
Add a Comment
2017-02-25
Recently, I've noticed a few great examples of misleading uses of numbers in news articles.
On 15 Feb, BBC News published a breaking news article with the headline
"UK unemployment falls by 7,000 to 1.6m".
This fall of 7,000 sounds big; but when compared to the total of 1.6m, it
is insignificant. The change could more accurately be described as a fall from 1.6m to 1.6m.
But there is a greater problem with this figure. In the
original Office of National Statistics (ONS) report,
the fall of 7,000 was accompanied by a 95% confidence interval of ±80,000.
When calculating figures about large populations (such as unemployment levels), it is impossible to ask every person in the UK whether they
are employed or not. Instead, data is gathered from a sample and this is used to estimate the total number. The 95% confidence interval
gives an idea of the accuracy of this estimation: 95% of the time, the true number will lie of the confidence interval. Therefore, we can
think of the 95% confidence interval as being a range in which the figure lies (although this is not true, it is a helpful way to think
about it).
Compared to the size of its confidence interval (±80,000), the fall of 7,000 is almost indistinguishable from zero. This means that it
cannot be said with any confidence whether the unemployment level rose or fell. This is demonstrated in the following diagram.
)
A fall of 7,000 ± 80,000. The orange line shows no change.
To be fair to the BBC, the headline of the article changed to "UK wage growth outpaces inflation"
once the article was upgraded from breaking news to a complete article, and a mention of the lack of confidence in the change was added.
On 23 Feb, I noticed another BBC News with misleading figures: Net migration to UK falls by 49,000.
This 49,000 is the difference between
322,000 (net migration for the year ending 2015) and
273,000 (net migration for the year ending 2016).
However both these figures are estimates: in the original ONS report,
they were placed in 95% confidence intervals of ±37,000 and ±41,000 respectively. As can be seen in the diagram below,
there is a significant portion where these intervals overlap, so it cannot be said with any confidence whether or not net immigration actually fell.
)
Net migration in 2014-15 and 2015-16.
Perhaps the blame for this questionable figure lies with the ONS, as it appeared prominently in their report while the discussion of its
accuracy was fairly well hidden. Although I can't shift all blame from the journalists: they should really be investigating the quality of these
figures, however well advertised their accuracy is.
Both articles criticised here appeared on BBC News. This is not due to the BBC being especially bad with figures, but simply due to the
fact that I spend more time reading news on the BBC than in other places, so noticed these figures there. I quick Google search reveals that the unemployment figure was
also reported, with little to no discussion of accuracy, by
The Guardian,
the Financial Times, and
Sky News.
(Click on one of these icons to react to this blog post)
You might also enjoy...
Comments
Comments in green were written by me. Comments in blue were not written by me.
I've seen archaeologists claiming proof that event A happened before event B because the radiocarbon date of A was 50 years before B. Except the standard error on both dates was 100 years. They even showed the error bars in their own graphics, but seemed to not understand what it meant.
My favorite species of ignoring the measurement error is the metric conversion taken to way too many decimal places. The hike was 50 miles (80.467 kilometers) long.×1 ×1 ×1 ×1 ×1
My favorite species of ignoring the measurement error is the metric conversion taken to way too many decimal places. The hike was 50 miles (80.467 kilometers) long.
Perry Ramsey
Add a Comment
2016-05-04
Back in 2014, I calculated the expected cost of
filling Panini world cup sticker album. I found that you should expect to buy
4505 stickers, or 1285 if you order the last 100 from the Panini website (this
includes the last 100). This would cost £413.24 or £133.99
respectively.
Euro 16 is getting close, so it's sticker time again. For the Euro 16
album there are 680 stickers to collect, 40 more than 2014's 640 stickers.
Using the same calculation method as before,
to fill the Euro 16 album, you should expect to buy 4828
stickers (£442.72), or 1400 (£134.32) if you order the last 100.
This, however, does not tell the whole story. Anyone who has collected
stickers as a child or an adult will know that half the fun comes from
swapping your doubles with friends. Getting stickers this way is not
taken into account in the above numbers.
Simulating a sticker collection
Including swaps makes the situation more complicated: too complicated
to easily calculate the expected cost of a full album. Instead, a different
method is needed. The cost of filling an album can be estimated by
simulating the collection lots of times and taking the average of the cost of
filling the album in each simulation. With enough simulations, this estimate
will be very close the the expected cost.
To get an accurate estimation, simulations are run,
calculating the running average as they go, until the running averages after recent simulations
are close together. (In the examples, I look for the four most recent running averages to be within 0.01.)
The plot below shows how the running average changes as more simulations are performed.
)
The simulations estimate the number of stickers needed as 4500. This is
very close to the 4505 I calculated last year.
Now that the simulations are set up, they can be used to see what happens if you have friends to swap with.
What should I do?
The plots below shows how the number of stickers you need to buy each changes based on how many friends you have.
)
Stickers needed if you and your friends order no stickers.
)
Stickers needed if you and your friends all order the last 100 stickers. The last 100 are not counted.
In both these cases, having friends reduces the number of stickers you need to buy significantly, with your first few friends
making the most difference.
Ordering the last 100 stickers looks to be a better idea than ordering no stickers. But how many stickers should you order to
minimise the cost? When you order stickers, you are guaranteed to get those that you need, but they cost more: ordered stickers cost 14p
each, while stickers in 6 pack multipacks come out at just 9.2p each. The next plot shows how the cost changes based on how many you order.
)
The expected cost of filling an album based on number of people in group and number of stickers ordered.
Each of the coloured curves represents a group of a different size. For each group, ordering no stickers works out the most
expensive—this is expected as so many stickers must be bought to find the last few stickers—and ordering all the stickers also works
out as not the best option. The best number to order
is somewhere in the middle, where the curve reaches its lowest point. The minimum points on each of these curves are summarised in the
next plots:
)
How the number you should order changes with the number of people in the group.
)
How the cost changes with the number of people in the group.
Again, having friends to swap with dramatically reduces the cost of filling an album. In fact, it will almost definitely pay off in future
swaps if you go out right now and buy starter packs for all your friends...
(Click on one of these icons to react to this blog post)
You might also enjoy...

Comments
Comments in green were written by me. Comments in blue were not written by me.
Add a Comment
2015-10-21
This post also appeared on the Chalkdust Magazine blog.
If you're like me, then you will be disappointed that all of the home nations have been knocked out of the Rugby World Cup. If you're really like me, doing some maths related to rugby will cheer you up...
The scoring system in rugby awards points in packets of 3, 5 and 7. This leads a number of interesting questions that you can find in my guest puzzle on Alex Bellos's Guardian blog. In this blog post, we will focus on another area of rugby: conversion kicking.
Conversion kicks
When a try is scored by putting the ball down behind the line, the scoring team gets to take a conversion kick. This kick must be taken in line with where the try was scored but it is up to the kicker how far away the kick should be taken. But how far back should the ball be taken to make the kick easiest?
)
Too close (red) and too far away (blue) will give small angles to aim at. Somewhere in the middle is needed (green).
One way to answer this question is to look to maximise the angle between the posts which the kicker will have to aim at: if the kick is taken too close to or too far from the goal line there will be a very thin angle to aim at. Somewhere between these extremes there will be a maximum angle to aim at.
When looking to maximise this angle, we can use one of the 'circle theorems' which have tormented many generations of GCSE maths students: 'angles subtended by the same arc at the circumference are equal'. This means that if a circle is drawn going through both posts, then the angle made at any point on this circle will be the same.
)
The angles made by the red and blue lines are equal because 'angles subtended by the same arc at the circumference are equal'.
A larger circle drawn through the posts will give a smaller angle. If a vertical line is drawn which just touches the right of the circle, then the point at which it touches the circle will be the best place on this line to take a kick. This is because any other point on the line will be on a larger circle and so make a smaller angle.
Using this method for circles of different sizes leads to the following diagram, which shows where the kick should be taken for every position a try could be scored:
)
The best place to take a kick?
This, however, is not the best place to take the kick.
Taking account of height
When a try is scored near the posts, the above method recommends a position from where the ball must be kicked at an impossibly steep angle to go over. To deal with this problem, we are going to have to look at the situation from the side.
When kicked, the ball will travel along a parabola (ignoring air resistance and wind as their effects will be small[citation needed]). Given a distance from the posts, there will be two angles which the ball can be kicked at and just make it over the bar. Kicking at any angle between these two will lead to a successful conversion. Again, we have an angle which we would like to maximise.
)
The highest (blue) and lowest (red) the ball can be kicked while still going over the bar.
However, the position where this angle is maximised is very unlikely to also maximise the angle we looked at earlier. To find the best place to kick from, we need to find a compromise point where both angles are quite big.
To do this, imagine that the kicker is standing inside a large sphere. For each point on the sphere, kicking the ball at the point will either lead to it going over or missing. We can draw a shape on the sphere so that aiming inside the shape will lead to scoring. Our sensible kicker will aim at the centre of this shape.
But our kicker will not be able to aim perfectly: there will be some random variation. We can predict that this variation will follow a Kent distribution, which is like a normal distribution but on the surface of a sphere. We can use this distribution to calculate the probability that our kicker will score. We would like to maximise this probability.
The Kent distribution can be adjusted to reflect the accuracy of the kicker. Below are the optimal kicking positions for an inaccurate, an average and a very accurate kicker.
)
)
)
The best place to take a kick for a bad kicker (top), an average kicker (middle) and a good kicker (bottom). All the kickers kick the ball at 30m/s.
As you might expect, the less accurate kicker should stand slightly further forwards to make it easier to aim. Perhaps surprisingly, the good kicker should stand further back when between the posts than when in line with the posts.
The model used to create these results could be further refined. Random variation in the speed of the kick could be introduced. Or the kick could be made to have more variation horizontally than vertically: there are parameters in the Kent distribution which allow this to be easily adjusted. In fact, data from players could be used to determine the best position for each player to kick from.
In addition to analysing conversions, this method could be used to determine the probability of scoring 3 points from any point on the pitch. This could be used in conjunction with the probability of scoring a try from a line-out to decide whether kicking a penalty for the posts or into touch is likely to lead to the most points.
Although estimating the probability of scoring from a line-out is a difficult task. Perhaps this will give you something to think about during the remaining matches of the tournament.
(Click on one of these icons to react to this blog post)
You might also enjoy...
Comments
Comments in green were written by me. Comments in blue were not written by me.
Add a Comment
I'm not certain whether they guarantee that there are no duplicates in a pack or just it's very unlikely... Follow up post looking into this coming soon