
Blog
2025-06-08
This week, Joel Riley's Every 5×5 Nonogram website
has been doing the rounds. The website includes every nonogram on a 5 by 5 grid that's solvable
without using trial-and-error, and anyone who visits the site can help to solve them all.
At the time of writing, around a quarter of the puzzles have been solved, so if you want to
be part of solving them you'll need to be a bit quick. Be warned though, solving
them can be addictive.
For the uninitiated, a nonogram is a puzzle where you have to colour in some of the squares so that the blocks of coloured squares in each row and column have the sizes given.
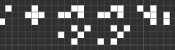
For example, this nongram:
)
... has this solution:
)
... because the first column contains one uninterrupted block of 5 black sqaures (5);
the second column contains two non-adjacent blocks of 1 black square (1 1); and so on. If a row or
column is empty, 0 is written in as its clue rather than leaving it blank.
After solving quite a few 5 by 5 nonograms, I started to wonder if I could make solvable nonograms that represented every letter of the alphabet.
Making letters
Making an alphabet of nonograms is harder than just drawing each letter, as not all 5 by 5 nonograms have a unique solution. For example, my first attempt to draw the letter X looked like this:
)
But this nonogram has a lot of solutions, including:
)
Checking that a 5×5 nonogram has a unique solution isn't too hard—you can do
this check by trying to solve it then seeing if you get to a point where there's more than one way
to finish—but it would be quite time consuming to do these for all 26 letters, so I wrote
a short Python script to do the checking for me. After a few minutes of tweaking some of the letters,
I had the alphabet.
Making words
Now that I had a nonogram for each letter of the alphabet, I had an idea: I could
use them to make wider nonograms (with a 0 column between them to prevent the letters touching).
Unfortunately, if two 5×5 nonograms both have
unique solutions, it doesn't necessarily follow that the wider nonogram made by putting them together
has a unique solution. For example, take the nonograms that were my first candidates for R and W:
)
There two nonograms both have a unique solution, but if you make a 5×11 nonogram by
placing them next to each other with a 0 column between them, you get a nonogram with multiple
solutions:
)
So my first attempt at the alphabet didn't give me a set of nonograms that I could use to spell
words. All was not lost though: after a bit of thinking I came up with an adjusted alphabet that
can be used to spell words and a justification for why any nonogram words built by putting these
letters in a rows will have a unique solution. These are the letters I ended up with:
)
If you'd like to make a nonogram for a word or your name, write it in the box below. You can click
on the nonogram that is creates to make it larger:
Why does this alphabet always make solvable words?
To show that this alphabet will always make solvable words, I first looked at every column of
every letter. For many column clues, there are squares that must always be black or always be white:
for example, if the column clue is 5, the squares must all be black; or if a column clue is 3, the
middle square in that column must be black. Looking at my alphabet, you can show that the black and
white squares in this diagram must be black or white, while the grey squares could still be either:
)
Next, suppose that the letter we're looking at is the leftmost letter in our nonogram, and consider the row clues.
We have to be a little bit careful here: we know that each row clue starts with the clue for the letter, but we don't know which numbers come next:
it could be possible to fit more or fewer of the row's black squares into the first letter.
Looking at the row clues carefully for each letter, we can add some more squares to our squares that we're certain are black or white (if our letter is leftmost):
)
We can now take another look at the columns using this new information, leading to:
)
And another look at the rows then the columns once again leave no grey squares:
)
Overall, this means that given any nonogram built from my alphabet, you can always solve the leftmost
letter. But if you then delete the first letter, you can solve for the second letter (as it's now the
first letter in the shorter nonogram). Then you can solve the third letter, and so on until you've
shown you can solve the full nonogram.
(Click on one of these icons to react to this blog post)
You might also enjoy...

Comments
Comments in green were written by me. Comments in blue were not written by me.
2025-06-09
@Dave Budd: I would guess that it doesn't unless I got very lucky, but I should write a script and check...Matthew
Nice argument for always solvable! I'm wondering if it also applies on a "2D" message, i.e. multiple rows of letters
Dave Budd
If you did numbers as well, you could make a meta nonogram, with the completed nonogram having numbers along the top and left, and gridlines. Or it could be a solved nonogram!×1 ×1
Boltí
Add a Comment
2023-02-03
Imagine a set of 142 points on a two-dimensional graph.
The mean of the \(x\)-values of the points is 54.26.
The mean of the \(y\)-values of the points is 47.83.
The standard deviation of the \(x\)-values is 16.76.
The standard deviation of the \(y\)-values is 26.93.
What are you imagining that the data looks like?
Whatever you're thinking of, it's probably not this:
)
The datasaurus.
This is the datasaurus, a dataset that was created by Alberto Cairo in
2016 to remind people to look beyond the summary statistics when analysing a dataset.
Anscombe's quartet
In 1972, four datasets with a similar aim were publised. Graphs in statistical analysis by Francis J Anscombe [1] contained four datasets that have become known as Anscombe's quartet: they all have the same
mean \(x\)-value, mean \(y\)-value, standard deviation of \(x\)-values, standard deviation of \(y\)-values, linear regression line, as well multiple other values
related to correlation and variance. But if you plot them, the four datasets look very different:
)
Plots of the four datasets that make up Anscombe's quartet. For each set of data:
the mean of the \(x\)-values is 9; the mean of the \(y\)-values is 7.5;
the standard deviation of the \(x\)-values is 3.32; the standard deviation of the \(y\)-values is 2.03;
the correlation coefficient between \(x\) and \(y\) is 0.816;
the linear regression line is \(y=3+0.5x\);
and coefficient of determination of linear regression is 0.667.
Anscombe noted that there were prevalent attitudes that:
- "Numerical calculations are exact, but graphs are rough."
- "For any particular kind of statistical data, there is just one set of calculations constituting a correct statistical analysis."
- "Performing intricate calculations is virtuous, actually looking at the data is cheating."
The four datasets were designed to counter these by showing that data exhibiting the same statistics can actually be very very different.
The datasaurus dozen
Anscombe's datasets indicate their point well, but the arrangement of the points is very regular and looks a little artificial when compared with real data sets.
In 2017, twelve sets of more realistic-looking data were published (in Same stats, different graphs: generating datasets with varied appearance and identical statistics through simulated annealing by Justin Matejka and George Fitzmaurice [2]).
These datasets—known as the datasaurus dozen—all had the same
mean \(x\)-value, mean \(y\)-value,
standard deviation of \(x\)-values, standard deviation of \(y\)-values, and corellation coefficient (to two decimal places) as the datasaurus.
)
The twelve datasets that make up the datasaurus dozen. For each set of data (to two decimal places):
the mean of the \(x\)-values is 54.26; the mean of the \(y\)-values is 47.83;
the standard deviation of the \(x\)-values is 16.76; the standard deviation of the \(y\)-values is 26.93;
the correlation coefficient between \(x\) and \(y\) is -0.06.
Creating datasets like this is not trivial: if you have a set of values for the statistical properties of a dataset, it is difficult to create a dataset with those properties—especially
one that looks like a certain shape or pattern.
But if you already have one dataset with the desired properties, you can make other datasets with the same properties by very slightly moving every point in a random direction then
checking that the properties are the same—if you do this a few times, you'll eventually get a second dataset with the right properties.
The datasets in the datasaurus dozen were generated using this method: repeatedly adjusting all the points ever so slightly, checking if the properties were the same, then
keeping the updated data if it's closer to a target shape.
The databet
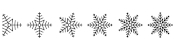
Using the same method, I generated the databet: a collection of datasets that look like the letters of the alphabet. I started with this set
of 100 points resembling a star:
)
My starting dataset
After a long time repeatedly moving points by a very small amount, my computer eventually generated these 26 datasets, all of which have the same means,
standard deviations, and correlation coefficient:
)
The databet. For each set of data (to two decimal places):
the mean of the \(x\)-values is 0.50; the mean of the \(y\)-values is 0.52;
the standard deviation of the \(x\)-values is 0.17; the standard deviation of the \(y\)-values is 0.18;
the correlation coefficient between \(x\) and \(y\) is 0.16.
Words
Now that we have the alphabet, we can write words using the databet. You can enter a word or phrase here to do this:
Given two data sets with the same number of points, we can make a new larger dataset by including all the points in both the smaller sets.
It is possible to write the mean and standard deviation of the larger dataset in terms of the means and standard deviations of the smaller sets: in each case,
the statistic of the larger set depends only on the statistics of the smaller sets and not on the actual data.
Applying this to the databet, we see that the datasets that spell words of a fixed length will all have the same mean and standard deviation.
(The same is not true, sadly, for the correlation coefficient.) For example, the datasets shown in the following plot both have the same means and standard deviations:
)
Datasets that spell "TRUE☆" and "FALSE". For both sets of (to two decimal places):
the mean of the \(x\)-values is 2.50; the mean of the \(y\)-values is 0.52;
the standard deviation of the \(x\)-values is 1.42; the standard deviation of the \(y\)-values is 0.18.
Hopefully by now you agree with me that Anscombe was right: it's very important to plot data as well as looking at the summary statistics.
If you want to play with the databet yourself, all the letters are available on GitHub in JSON format.
The GitHub repo also includes fonts that you can download and install so you can use Databet Sans in
your next important document.
References
[1] Graphs in statistical analysis by Francis J Anscombe. American Statistician, 1973.
[2] Same stats, different graphs: generating datasets with varied appearance and identical statistics through simulated annealing by Justin Matejka and George Fitzmaurice. Proceedings of the 2017 CHI Conference on Human Factors in Computing Systems, 2017.
(Click on one of these icons to react to this blog post)
You might also enjoy...

Comments
Comments in green were written by me. Comments in blue were not written by me.
Add a Comment
2016-06-05
The Game of Life is a cellular automaton invented by John Conway in 1970,
and popularised by Martin Gardner.
In Life, cells on a square grid are either alive or dead. It begins
at generation 0 with some cells alive and some dead. The cells' aliveness in
the following generations are defined by the following rules:
- Any live cell with four or more live neighbours dies of overcrowding.
- Any live cell with one or fewer live neighbours dies of loneliness.
- Any dead cell with exactly three live neighbours comes to life.
Starting positions can be found which lead to all kinds of behaviour:
from making gliders
to generating prime numbers.
The following starting position is one of my favourites:
)
It looks boring enough, but in the next generation, it will look like this:
)
If you want to confirm that I'm not lying, I recommend the free Game of Life Software Golly.
Going backwards
You may be wondering how I designed the starting pattern above. A first, it looks like a difficult task: each cell can be dead or alive,
so I need to check every possible combination until I find one. The number of combinations will be \(2^\text{number of cells}\). This will
be a very large number.
There are simplifications that can be made, however. Each of the letters above (ignoring the gs) is in a 3×3 block, surrounded
by dead cells. Only the cells in the 5×5 block around this can affect the letter. These 5×5 blocks do no overlap, so can be
calculated seperately. I doesn't take too long to try all the possibilities for these 5×5 blocks. The gs were then made by starting with an o and trying adding cells below.
Can I make my name?
Yes, you can make your name.
I continued the search and found a 5×5 block for each letter. Simply Enter your name in the box below and
these will be combined to make a pattern leading to your name!
(Click on one of these icons to react to this blog post)
You might also enjoy...


Comments
Comments in green were written by me. Comments in blue were not written by me.
Add a Comment