
Blog
2023-03-14
A circle of radius \(r\) on a piece of paper can be thought of as a line through all the points on the paper that are a distance \(r\) from the centre of the circle.
The length of this line (ie the circumference) is \(2\pi r\).
Due to the curvature of the Earth, the line through all the points that are a distance \(r\) from where you are currently standing will be less than \(2\pi r\) (although you might
not notice the difference unless \(r\) is very big). The type of curvature that a sphere has is often called positive curvature.
It is also possible to create surfaces that have negative curvature; or surfaces where the length of the line through all the points that are a distance \(r\) from a point is more than \(2\pi r\).
These surfaces are called hyperbolic surfaces.
Hyperbolic surfaces
The most readily available example of a hyperbolic surface is a Pringle: Pringles are curved upwards in one direction, and curved downwards in the other direction.
)
Pringles
It's not immediately obvious what a larger hyperbolic surface would look like, but you can easily make one if you know how to crochet: simply increase the number of stitches at a
constant rate.
)
A hyperolic surface that I crocheted
If it was possible to continue crocheting forever, you'd get an unbounded hyperbolic surface: the hyperbolic plane.
Over the last few weeks, I've been working on adding hyperbolic levels to Mathsteroids, the asteroids-inspired game that I started making levels for in 2018.
There are quite a few different ways to represent the hyperbolic plane in 2D. In this blog post we'll take a look at some of these; I encourage you to play the Mathsteroids level for each one as you
read so that you can get a feeling for their behaviour.
Poincaré disk
The Poincaré disk represents the hyperbolic plane as the interior of a circle. As objects move away from the centre of the circle, they appear smaller and smaller; and the circumference of
the circle is infinitely far from the centre of the circle. Straight lines on the hyperbolic plane appear on the Poincaré disk as either circles that meet the edge of the disk at right angles,
or straight lines through the centre of the circle.
)
Some examples of straight lines represented on the Poincaré disk
One of the nicest properties of the Poincaré disk is that it correctly represents angles: If you measure the angle between to intersecting straight lines represented on the disk, then the value
you measure will be the same as the angles between the two lines in the actual hyperbolic plane.
This representation can be used to demonstrate some interesting properties of the hyperbolic plane.
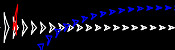
In normal two dimensional space, if you are given a line and a point then there is exactly one line that goes through the point and is parallel to the first line.
But in hyperbolic space, there are many such parallel lines.
)
Parallel lines on the Poincaré disk: all of the red lines are parallel to the blue line
In Mathsteroids, there are two levels based on the Poincaré disk. The first level is bounded: you can only fly so far from the centre of the circle before
you hit the edge of the level and bounce back. (This prevents you from getting lost in the part of the disk where you would appear very very small.)
The second level is unbounded. In this level, you can fly as far as you like in any direction, but the point which is at the centre of the
disk will change when you go too far to prevent the ship from getting to small.
Beltrami–Klein disk
Simlar to the Poincaré disk, the Beltrami–Klein disk represents the hyperbolic plane using the interior of a circle, with the edge of the circle infinitely far away. Straight lines
in hyperbolic space will appear as straight lines in the Beltrami–Klein disk. The Beltrami–Klein disk is closely related to the Poincaré disk: the same line represented on both disks
will have its endpoints at the same points on the circle (although these endpoints are arguably not part of the line as they are on the circle that is infinitely far away).
)
Some examples of straight lines represented on the Beltrami–Klein disk
Unlike in the Poincaré disk, angles are not correctly represented in the Beltrami–Klein disk. It can however be a very useful representation as straight lines appearing as straight lines
is a helpful feature.
Again, there are two Mathsteroids levels based on the Beltrami–Klein disk: a bounded level and an unbounded level.
Poincaré half-plane
The Poincaré half-plane represents the hyperbolic plane using the half-plane above the \(x\)-axis. Straight lines in hyperbolic space are represented by either vertical
straight lines or semicircles with their endpoints on the \(x\)-axis.
)
Some examples of straight lines represented on the Poincaré half-plane
Like the Poincaré disk, the Poincaré half-plane correctly represents the angles between lines.
There is one Mathsteroids level based on the Poincaré half-plane: this level is bounded so you can only travel so far away from where you start.
Band
The band representation represents the hyperbolic plane as the strip between two horizontal lines. The strip extends forever to the left and right.
Straight lines on the band come in a variety of shapes.
)
Some examples of straight lines represented on the band
There is one Mathsteroids level based on the band representation: the bounded level.
Hyperboloid and Gans plane
The hyperbolic plane can be represented on the surface of a hyperboloid. A hyperboloid is the shape you get if you rotate and hyperbola (a curve shaped like \(y=1/x\).)
)
A hyperbola
)
A hyperboloid
Straight lines on this representation are the intersections of the hyperboloid with flat planes that go through the origin.
You can see what these straight lines look like by playing the (bounded) Mathsteroids level based on the hyperboloid.
The Gans plane is simply the hyperboloid viewed from above. There is a (bounded) Mathsteroids level based on the Gans plane.
(Click on one of these icons to react to this blog post)
You might also enjoy...

Comments
Comments in green were written by me. Comments in blue were not written by me.
Add a Comment
2020-05-15
This is a post I wrote for The Aperiodical's Big Lock-Down Math-Off. You can vote for (or against) me here until 9am on Sunday...
Recently, I came across a surprising fact: if you take any quadrilateral and join the midpoints of its sides, then you will form a parallelogram.
)
The blue quadrilaterals are all parallelograms.
The first thing I thought when I read this was: "oooh, that's neat." The second thing I thought was: "why?" It's not too difficult to show why this is true; you might like to pause here and try to work out why yourself before reading on...
To show why this is true, I started by letting \(\mathbf{a}\), \(\mathbf{b}\), \(\mathbf{c}\) and \(\mathbf{d}\) be the position vectors of the vertices of our quadrilateral. The position vectors of the midpoints of the edges are the averages of the position vectors of the two ends of the edge, as shown below.
)
)
The position vectors of the corners and the midpoints of the edges.
We want to show that the orange and blue vectors below are equal (as this is true of opposite sides of a parallelogram).
)
We can work these vectors out: the orange vector is$$\frac{\mathbf{d}+\mathbf{a}}2-\frac{\mathbf{a}+\mathbf{b}}2=\frac{\mathbf{d}-\mathbf{b}}2,$$
and the blue vector is$$\frac{\mathbf{c}+\mathbf{d}}2-\frac{\mathbf{b}+\mathbf{c}}2=\frac{\mathbf{d}-\mathbf{b}}2.$$
In the same way, we can show that the other two vectors that make up the inner quadrilateral are equal, and so the inner quadrilateral is a parallelogram.
Going backwards
Even though I now saw why the surprising fact was true, my wondering was not over. I started to think about going backwards.
It's easy to see that if the outer quadrilateral is a square, then the inner quadrilateral will also be a square.
)
If the outer quadrilateral is a square, then the inner quadrilateral is also a square.
It's less obvious if the reverse is true: if the inner quadrilateral is a square, must the outer quadrilateral also be a square? At first, I thought this felt likely to be true, but after a bit of playing around, I found that there are many non-square quadrilaterals whose inner quadrilaterals are squares. Here are a few:
)
A kite, a trapezium, a delta kite, an irregular quadrilateral and a cross-quadrilateral whose innner quadrilaterals are all a square.
There are in fact infinitely many quadrilaterals whose inner quadrilateral is a square. You can explore them in this Geogebra applet by dragging around the blue point:
As you drag the point around, you may notice that you can't get the outer quadrilateral to be a non-square rectangle (or even a non-square parallelogram). I'll leave you to figure out why not...
(Click on one of these icons to react to this blog post)
You might also enjoy...


Comments
Comments in green were written by me. Comments in blue were not written by me.
Nice post! Just a minor nitpick, I found it weird that you say "In the same way, we can show that the other two vectors that make up the inner quadrilateral are equal, and so the inner quadrilateral is a parallelogram."
This is true but it's not needed (it's automatically true), you have in fact already proved that this is a parallelogram, by proving that two opposite sides have same length and are parallel (If you prove that the vectors EF and GH have the same coordinates, then EFHG is a parallelogram.) ×2 ×2 ×2 ×2 ×2
This is true but it's not needed (it's automatically true), you have in fact already proved that this is a parallelogram, by proving that two opposite sides have same length and are parallel (If you prove that the vectors EF and GH have the same coordinates, then EFHG is a parallelogram.)
Vivien
mscroggs.co.uk is interesting as far as MATHEMATICS IS CONCERNED!×2 ×3 ×2 ×2 ×4
DEB JYOTI MITRA
Add a Comment
2019-04-09
In the latest issue of Chalkdust,
I wrote an article
with Edmund Harriss about the Harriss spiral that appears on the cover of the magazine.
To draw a Harriss spiral, start with a rectangle whose side lengths are in the plastic ratio; that is the ratio \(1:\rho\)
where \(\rho\) is the real solution of the equation \(x^3=x+1\), approximately 1.3247179.
)
A plastic rectangle
This rectangle can be split into a square and two rectangles similar to the original rectangle. These smaller rectangles can then be split up in the same manner.
)
)
Splitting a plastic rectangle into a square and two plastic rectangles.
Drawing two curves in each square gives the Harriss spiral.
)
)
A Harriss spiral
This spiral was inspired by the golden spiral, which is drawn in a rectangle whose side lengths are in the golden ratio of \(1:\phi\),
where \(\phi\) is the positive solution of the equation \(x^2=x+1\) (approximately 1.6180339). This rectangle can be split into a square and one
similar rectangle. Drawing one arc in each square gives a golden spiral.
)
)
A golden spiral
Continuing the pattern
The golden and Harriss spirals are both drawn in rectangles that can be split into a square and one or two similar rectangles.
)
The rectangles in which golden and Harriss spirals can be drawn.
Continuing the pattern of these arrangements suggests the following rectangle, split into a square and three similar rectangles:
)
Let the side of the square be 1 unit, and let each rectangle have sides in the ratio \(1:x\). We can then calculate that the lengths of
the sides of each rectangle are as shown in the following diagram.
)
The side lengths of the large rectangle are \(\frac{1}{x^3}+\frac{1}{x^2}+\frac2x+1\) and \(\frac1{x^2}+\frac1x+1\). We want these to also
be in the ratio \(1:x\). Therefore the following equation must hold:
$$\frac{1}{x^3}+\frac{1}{x^2}+\frac2x+1=x\left(\frac1{x^2}+\frac1x+1\right)$$
Rearranging this gives:
$$x^4-x^2-x-1=0$$
$$(x+1)(x^3-x^2-1)=0$$
This has one positive real solution:
$$x=\frac13\left(
1
+\sqrt[3]{\tfrac12(29-3\sqrt{93})}
+\sqrt[3]{\tfrac12(29+3\sqrt{93})}
\right).$$
This is equal to 1.4655712... Drawing three arcs in each square allows us to make a spiral from a rectangle with sides in this ratio:
)
)
A spiral which may or may not have a name yet.
Continuing the pattern
Adding a fourth rectangle leads to the following rectangle.
)
The side lengths of the largest rectangle are \(1+\frac2x+\frac3{x^2}+\frac1{x^3}+\frac1{x^4}\) and \(1+\frac2x+\frac1{x^2}+\frac1{x^3}\).
Looking for the largest rectangle to also be in the ratio \(1:x\) leads to the equation:
$$1+\frac2x+\frac3{x^2}+\frac1{x^3}+\frac1{x^4} = x\left(1+\frac2x+\frac1{x^2}+\frac1{x^3}\right)$$
$$x^5+x^4-x^3-2x^2-x-1 = 0$$
This has one real solution, 1.3910491... Although for this rectangle, it's not obvious which arcs to draw to make a
spiral (or maybe not possible to do it at all). But at least you get a pretty fractal:
)
Continuing the pattern
We could, of course, continue the pattern by repeatedly adding more rectangles. If we do this, we get the following polynomials
and solutions:
| Number of rectangles | Polynomial | Solution |
| 1 | \(x^2 - x - 1=0\) | 1.618033988749895 |
| 2 | \(x^3 - x - 1=0\) | 1.324717957244746 |
| 3 | \(x^4 - x^2 - x - 1=0\) | 1.465571231876768 |
| 4 | \(x^5 + x^4 - x^3 - 2x^2 - x - 1=0\) | 1.391049107172349 |
| 5 | \(x^6 + x^5 - 2x^3 - 3x^2 - x - 1=0\) | 1.426608021669601 |
| 6 | \(x^7 + 2x^6 - 2x^4 - 3x^3 - 4x^2 - x - 1=0\) | 1.4082770325090774 |
| 7 | \(x^8 + 2x^7 + 2x^6 - 2x^5 - 5x^4 - 4x^3 - 5x^2 - x - 1=0\) | 1.4172584399350432 |
| 8 | \(x^9 + 3x^8 + 2x^7 - 5x^5 - 9x^4 - 5x^3 - 6x^2 - x - 1=0\) | 1.412713760332943 |
| 9 | \(x^{10} + 3x^9 + 5x^8 - 5x^6 - 9x^5 - 14x^4 - 6x^3 - 7x^2 - x - 1=0\) | 1.414969877544769 |
The numbers in this table appear to be heading towards around 1.414, or \(\sqrt2\).
This shouldn't come as too much of a surprise because \(1:\sqrt2\) is the ratio of the sides of A\(n\) paper (for \(n=0,1,2,...\)).
A0 paper can be split up like this:
)
Splitting up a piece of A0 paper
This is a way of splitting up a \(1:\sqrt{2}\) rectangle into an infinite number of similar rectangles, arranged following the pattern,
so it makes sense that the ratios converge to this.
Other patterns
In this post, we've only looked at splitting up rectangles into squares and similar rectangles following a particular pattern. Thinking about
other arrangements leads to the following question:
Given two real numbers \(a\) and \(b\), when is it possible to split an \(a:b\) rectangle into squares and \(a:b\) rectangles?
If I get anywhere with this question, I'll post it here. Feel free to post your ideas in the comments below.
(Click on one of these icons to react to this blog post)
You might also enjoy...
Comments
Comments in green were written by me. Comments in blue were not written by me.
@g0mrb: CORRECTION: There seems to be no way to correct the glaring error in that comment. A senior moment enabled me to reverse the nomenclature for paper sizes. Please read the suffixes as (n+1), (n+2), etc.
(anonymous)
I shall remain happy in the knowledge that you have shown graphically how an A(n) sheet, which is 2 x A(n-1) rectangles, is also equal to the infinite series : A(n-1) + A(n-2) + A(n-3) + A(n-4) + ... Thank-you, and best wishes for your search for the answer to your question.
g0mrb
Add a Comment
2018-07-07
So you've calculated how much you should expect the World Cup sticker book to cost
and recorded how much it actually cost. You might be wondering what else you can do with your sticker book.
If so, look no further: this post contains 5 mathematical things involvolving your sticker book and stickers.
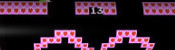
Test the birthday paradox
)
Stickers 354 and 369: Alisson and Roberto Firmino
In a group of 23 people, there is a more than 50% chance that two of them will share a birthday. This is often called the birthday paradox, as the number 23 is surprisingly small.
Back in 2014 when Alex Bellos suggested testing the birthday paradox on World Cup squads, as there are 23 players in a World Cup squad. I recently discovered that even further back in 2012, James Grime made a video about the birthday paradox in football games, using the players on both teams plus the referee to make 23 people.
In this year's sticker book, each player's date of birth is given above their name, so you can use your sticker book to test it out yourself.
Kaliningrad
)
Sticker 022: Kaliningrad
One of the cities in which games are taking place in this World Cup is Kaliningrad. Before 1945, Kaliningrad was called Königsberg. In Königsburg, there were seven bridges connecting four islands. The arrangement of these bridges is shown below.
)
The people of Königsburg would try to walk around the city in a route that crossed each bridge exactly one. If you've not tried this puzzle before, try to find such a route now before reading on...
In 1736, mathematician Leonhard Euler proved that it is in fact impossible to find such a route. He realised that for such a route to exist, you need to be able to pair up the bridges on each island so that you can enter the island on one of each pair and leave on the other. The islands in Königsburg all have an odd number of bridges, so there cannot be a route crossing each bridge only once.
In Kaliningrad, however, there are eight bridges: two of the original bridges were destroyed during World War II, and three more have been built. Because of this, it's now possible to walk around the city crossing each bridge exactly once.
)
A route around Kaliningrad crossing each bridge exactly once.
I wrote more about this puzzle, and using similar ideas to find the shortest possible route to complete a level of Pac-Man, in this blog post.
Sorting algorithms
If you didn't convince many of your friends to join you in collecting stickers, you'll have lots of swaps. You can use these to practice performing your favourite sorting algorithms.
Bubble sort
In the bubble sort, you work from left to right comparing pairs of stickers. If the stickers are in the wrong order, you swap them. After a few passes along the line of stickers, they will be in order.
)
Bubble sort
Insertion sort
In the insertion sort, you take the next sticker in the line and insert it into its correct position in the list.
)
Insertion sort
Quick sort
In the quick sort, you pick the middle sticker of the group and put the other stickers on the correct side of it. You then repeat the process with the smaller groups of stickers you have just formed.
)
Quick sort
The football
)
Sticker 007: The official ball
Sticker 007 shows the official tournament ball. If you look closely (click to enlarge), you can see that the ball is made of a mixture of pentagons and hexagons. The ball is not made of only hexagons, as road signs in the UK show.
Stand up mathematician Matt Parker started a petition to get the symbol on the signs changed, but the idea was rejected.
If you have a swap of sticker 007, why not stick it to a letter to your MP about the incorrect signs as an example of what an actual football looks like.
Psychic pets
Speaking of Matt Parker, during this World Cup, he's looking for psychic pets that are able to predict World Cup results. Why not use your swaps to label two pieces of food that your pet can choose between to predict the results of the remaining matches?
)
)
Timber using my swaps to wrongly predict the first match
(Click on one of these icons to react to this blog post)
You might also enjoy...


Comments
Comments in green were written by me. Comments in blue were not written by me.
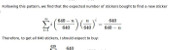
@Matthew: Thank you for the calculations. Good job I ordered the stickers I wanted #IRN. 2453 stickers - that's more than the number you bought (1781) to collect all stickers!
Milad
@Matthew: Here is how I calculated it:
You want a specific set of 20 stickers. Imagine you have already \(n\) of these. The probability that the next sticker you buy is one that you want is
$$\frac{20-n}{682}.$$
The probability that the second sticker you buy is the next new sticker is
$$\mathbb{P}(\text{next sticker is not wanted})\times\mathbb{P}(\text{sticker after next is wanted})$$
$$=\frac{662+n}{682}\times\frac{20-n}{682}.$$
Following the same method, we can see that the probability that the \(i\)th sticker you buy is the next wanted sticker is
$$\left(\frac{662+n}{682}\right)^{i-1}\times\frac{20-n}{682}.$$
Using this, we can calculate the expected number of stickers you will need to buy until you find the next wanted one:
$$\sum_{i=1}^{\infty}i \left(\frac{20-n}{682}\right) \left(\frac{662+n}{682}\right)^{i-1} = \frac{682}{20-n}$$
Therefore, to get all 682 stickers, you should expect to buy
$$\sum_{n=0}^{19}\frac{682}{20-n} = 2453 \text{ stickers}.$$
Matthew
@Matthew: Yes, I would like to know how you work it out please. I believe I have left my email address in my comment. It seems like a lot of stickers if you are just interested in one team.
Milad
@Milad: Following a similiar method to this blog post, I reckon you'd expect to buy 2453 stickers (491 packs) to get a fixed set of 20 stickers. Drop me an email if you want me to explain how I worked this out.
Matthew
Thanks for the maths, but I have one probability question. How many packs would I have to buy, on average, to obtain a fixed set of 20 stickers?
Milad
Add a Comment
2018-07-06
This is a post I wrote for round 1 of The Aperiodical's Big Internet Math-Off 2018, where Mathsteroids lost to MENACE.
A map projection is a way of representing the surface of a sphere, such as the Earth, on a flat surface. There is no way to represent all the features of a sphere on a flat surface, so if you want a map that shows a certain feature of the world, then you map will have to lose some other feature of the world in return.
To show you what different map projections do to a sphere, I have created a version of the game Asteroids on a sphere. I call it Mathsteroids. You can play it here, or follow the links below to play on specific projections.
Mercator projection
The most commonly used map projection is the Mercator projection, invented by Gerardus Mercator in 1569. The Mercator projection preserves angles: if two straight lines meet at an angle \(\theta\) on a sphere, then they will also meet at an angle \(\theta\) on the map. Keeping the angles the same, however, will cause the straight lines to no longer appear straight on the map, and the size of the same object in two different place to be very different.
The angle preserving property means that lines on a constant bearing (eg 030° from North) will appear straight on the map. These constant bearing lines are not actually straight lines on the sphere, but when your ship is already being buffeted about by the wind, the waves, and the whims of drunken sailors, a reasonably straight line is the best you can expect.
The picture below shows what three ships travelling in straight lines on the sphere look like on a Mercator projection.
)
To fully experience the Mercator projection, you can play Mathsteroids in Mercator projection mode here. Try flying North to see your spaceship become huge and distorted.
Gall–Peters projection
The Gall–Peters projection (named after James Gall and Arno Peters) is an area-preserving projection: objects on the map will have the same area as objects on the sphere, although the shape of the object on the projection can be very different to its shape on the sphere.
The picture below shows what three spaceships travelling in straight lines on a sphere look like on the Gall–Peters projection.
)
You can play Mathsteroids in Gall–Peters projection mode here. I find this one much harder to play than the Mercator projection, as the direction you're travelling changes in a strange way as you move.
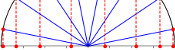
Azimuthal projection
)
The emblem of the UN
An azimuthal projection makes a map on which the directions from the centre point to other points on the map are the same as the directions on the sphere. A map like this could be useful if, for example, you're a radio operator and need to quickly see which direction you should point your aerial to communicate with other points on the map.
The azimuthal projection I've used in Mathsteroids also preserves distances: the distance from the centre to the another points on the map is proportional to the actual distance on the sphere. This projection is used as the emblem of the UN.
The picture below shows three straight lines on this projection. You can play Mathsteroids in azimuthal mode here.
)
Craig retroazimuthal projection
A retroazimuthal projection makes a map on which the directions to the centre point from other points on the map are the same as the directions on the sphere. If you're thinking that this is the same as the azimuthal projection, then you're too used to doing geometry on flat surfaces: on a sphere, the sum of the angles in a triangle depends on the size of the triangle, so the directions from A to B and from B to A aren't as closely related as you would expect.
The Craig retroazimuthal projection was invented by James Ireland Craig in 1909. He used Mecca as his centre point to make a map that shows muslims across the world which direction they should face to pray.
The picture below shows what three spaceships travelling in a straight lines on a sphere looks like on this projection.
)
You can play Mathsteroids in Craig retroazimuthal mode here to explore the projection yourself. This is perhaps the hardest of all to play, as (a) two different parts of the sphere overlap on the map, and (b) the map is actually infinitely tall, so quite a bit of it is off the edge of the visible game area.
Stereographic projection
The final projection I'd like to show you is the stereographic projection.
Imagine that a sphere is sitting on a 2D plane. Take a point on the sphere. Imagine a straight line through this point and the point at the top of the sphere. The point where this line meets the 2D plane is stereographic projection of the point on the sphere.
)
The stereographic projection
This projection (backwards) can be used to represent the every complex number as a point on a sphere: this is called the Riemann sphere.
To make Mathseteroids playable after this projection, I split the sphere into 2 hemisphere and projected each seperately to give two circles. You can play Mathsteroids in stereographic projection mode here. Three spaceships travelling in straight lines on this projection are shown below.
)
... and if you still don't like map projections, you can still enjoy playing Mathsteroids on an old fashioned torus. Or on a Klein bottle or the real projective plane. Don't forget to take a short break from playing to head over to The Aperiodical and vote (voting now closed).
(Click on one of these icons to react to this blog post)
You might also enjoy...
Comments
Comments in green were written by me. Comments in blue were not written by me.
Add a Comment