
Blog
2025-11-20
The mscroggs.co.uk Advent Calendar is back for its eleventh year, making it the Advent calendar's tenth anniversary!
Behind each door, there will be a puzzle with a three digit solution. The solution to each day's puzzle forms part of a logic puzzle:
It's nearly Christmas and something terrible has happened: after years of gradual wear and tear, Santa's magic sleigh has fallen apart.
You need to help Santa build a new sleigh so that he can deliver presents before Christmas is ruined for everyone.
The magic sleigh was built from parts bought from magic factories all over the world, and only the exact combination of parts will be magic enough to let Santa deliver all
the world's presents on Christmas Eve—but it's been a long time since a magic sleigh was last built and no-one can remember exactly which combination of parts is needed.
Behind the first 24 doors on the Advent calendar, there are puzzles with three-digit answers. Each of these answers forms part of piece of information about the sleigh that
Santa and his elves can remember: you need to use this information to work out which runners, chassis, present holder, seat for Santa, and front of the sleigh with reins
you need to order from the nine suppliers (numbered from 1 to 9) that Santa can order parts from.
You can use this page to try ordering parts for a sleigh, but you can only try ordering three times per day (or Santa's suppliers will get
very angry about cancelled orders).
Ten randomly selected people who solve all the puzzles, build a magic sleigh, and fill in the entry form behind the door on the 25th will win prizes!
)
The prizes will include an mscroggs.co.uk Advent 2025 T-shirt. If you'd like one of the T-shirts from a previous Advent, they are available to order at merch.mscroggs.co.uk.
The winners will be randomly chosen from all those who submit the entry form before the end of 2025. Each day's puzzle (and the entry form on Christmas Day) will be available from 5:00am GMT. But as the winners will be selected randomly,
there's no need to get up at 5am on Christmas Day to enter!
As you solve the puzzles, your answers will be stored. To share your stored answers between multiple devices, enter your email address below the calendar and you will be emailed a magic link to visit on your other devices.
To win a prize, you must submit your entry before the end of 2025. Only one entry will be accepted per person. If you have any questions, ask them in the comments below,
on Bluesky,
or on Mastodon.
If you'd like to chat with other solvers, we'll be discussing the Advent Calendar in the #scroggs-advent-calendar channel in the Finite Group Discord: you
can join the Discord by following the link in this post on Patreon (you'll need to become a free member
on Patreon to unlock the post).
So once December is here, get solving! Good luck and have a very merry Christmas!
(Click on one of these icons to react to this blog post)
You might also enjoy...


Comments
Comments in green were written by me. Comments in blue were not written by me.
@Artie: Yes, I will be. A cold wiped out the bit of the year between new year and going back to work so it's later than usual but it will be done soon. ×1 ×2
×1 ×2
Matthew
You usually post a list of successful entries - will you be doing so this year (or can I just not find it). I have gotten a number of my students into doing this each year and I am keen to see if any are still doing it.
Artie
I am so excited to share with you my greatest testimony how Dr Marcus made me achieve my dreams after 10 years of playing the lottery. I saw a couple of comments about him several years ago. I wondered how it was possible. Until it finally works for me the numbers he gave me were what I played, I'm still in shock. I, a Lapeer county man, won the $1,000,000 power ball, the only word I can use to describe the feelings of finding out that I have won the 1 million dollars is shocking. I am just now believing that this is real. Dr Marcus is indeed a powerful man. You can reach him at drmacusspellcaster@gmail.com or whatsapp him at +234 811 049 2028
robert benaglio
I couldn't figure out a rule for 21/14 so I decided to count it, realized that I had only gotten 1/8 of the way through with the counting in 5 days, so I took the result at the time, multiplied it by 4, then brute forced it down. I figured one out after though. Good puzzles \|
Durango Koval
Great year-end fun as usual! Will there be some kind of annotated solutions afterwards? Also hoping to use this space to discuss the solutions after the competition is closed. Especially interested in the neat solutions for 14 and 21 that some commenters alluded to. If allowed, would also like to share some insights for 9 which many seemed to struggle with (brute force not needed!) after the competition closes.
H.Hung
Add a Comment
2025-09-06
Recently, Matt Parker released a video about a puzzle related to the year 2025:
due to 2025 being the square of a triangle number, the following fact is true:
$$
1^3+2^3+3^3+4^3+5^3+6^3+7^3+8^3+9^3
=
(1+2+3+4+5+6+7+8+9)^2
= 2025.
$$
This fact can be rexpressed as: the total area of
one 1×1 square, two 2×2 squares, three 3×3 squares and so on up to nine 9×9 squares
is the same as the area of a 45 by 45 square. This leads to a question: is it possible to arrange this large collection of squares to make the larger square?
The general form of this puzzle (where we sum to \(n\) rather than to 9) is called the partridge puzzle. It was named this by Robert Wainwright
as the version with \(n=12\) reminded him of the total number of gifts in the 12 days of Christmas (although this link isn't exact as the total number of gifts is
12×1 + 11×2 + 10×3 + ... + 1×12 rather than the sum of the cubes).
For Matt's video, I made an interactive tool that lets you arrange the pieces and attempt to solve the problem: you can play with it at mscroggs.co.uk/squares.
How many solutions?
When \(n=1\), the question becomes the very boring "can you arrange a 1×1 square to make a 1×1 square?". The answer is clearly "yes".
For \(n=2\) and \(n=3\), you should be able to convince yourself that it's impossible. It's harder to convince youself what's going on for larger value of \(n\), but I can tell you that
for \(n=4\) there are no solutions. Similarly for \(n=5\), \(n=6\) and \(n=7\) there are no solutions.
You may be starting to think that for any \(n\) except 1 there won't be solutions, but surprisingly there are 18656 solutions for \(n=8\) (or 2332 solutions if you count rotations and
reflections as the same solution). For \(n=9\) (the 2025 version of the puzzle), there are also a lot of solutions. I wrote some code for Matt to find them all: there are 1730280 of them (or 216285
if you count rotations and reflections as the same solution). You can download a zip file containing all the solutions from Zenodo.
Let me know if you do anything interesting with these solutions.
)
One of the solutions for \(n=9\)
None of the solutions for \(n=8\) or \(n=9\) has rotational or reflectional symmetry. I conjecture that there are no symmetric solutions for any \(n\) greater than this: it's reasonably easy to explain why there can never be a solution with rotational symmetry (unless \(n=1\)), but I haven't yet found a good justification for why there
aren't reflectionally symmetric solutions.
For \(n=10\), it is currently unknown how many solutions there are and so the OEIS sequence
(that gives the counts if rotations and reflections count as the same solution) stops at \(n=9\). My code that generated all the solution for \(n=9\) took around a week to find
all the solutions, so very much isn't capable of working out the number of solutions for \(n=10\).
Heat maps
Once I had the list of all solutions, I decided to make some heat maps to show where each piece
was most commonly placed. Here's the heat map for the 1×1 square:
)
Heat map of the location of the 1×1 square in the puzzle for \(n=9\): white squares will never contain the 1×1 square; the darker the red, the more likely the position is to contain the 1×1 square.
The amount of white (or near-white) in the plot surprised me: there's some positions that the 1×1 squares is placed in a lot and it nearly never ends up in many places. Here's the heat maps for the 2×2 to 9×9 squares:
)
)
)
)
)
)
)
)
Heat maps of the locations of the 2×2 to 9×9 squares for \(n=9\)
(Click on one of these icons to react to this blog post)
You might also enjoy...

Comments
Comments in green were written by me. Comments in blue were not written by me.
Hi,
I am the author of the OEIS sequence. It's a pity that the sequence was not mentioned in Matt Parker's video.
Earlier this year I've made some analysis of the solutions: https://habr.com/ru/articles/889958/
In particular, there are solutions where all squares from 1 to 9 stack in one row or column (1+2+...+9 = 45).
As for the symmetry, the proof is the following: The symmetry could be horizontal (which is nearly the same as vertical) or diagonal.
In case of horizontal, the square of size 1 must be located on the center line. It will be either near the wall, or between 2 larger squares, that are centered on the center line. In both cases a lane of width 1 arises, that cannot be filled with any other square.
In case of diagonal, the square of size 1 must be on the diagonal and at first sight there is no lane of width 1. But, as long as you put all diagonal squares and then any square adjacent to the square of size 1, such a lane arises.
Your heatmap for size 1 is great!
×1 ×1
I am the author of the OEIS sequence. It's a pity that the sequence was not mentioned in Matt Parker's video.
Earlier this year I've made some analysis of the solutions: https://habr.com/ru/articles/889958/
In particular, there are solutions where all squares from 1 to 9 stack in one row or column (1+2+...+9 = 45).
As for the symmetry, the proof is the following: The symmetry could be horizontal (which is nearly the same as vertical) or diagonal.
In case of horizontal, the square of size 1 must be located on the center line. It will be either near the wall, or between 2 larger squares, that are centered on the center line. In both cases a lane of width 1 arises, that cannot be filled with any other square.
In case of diagonal, the square of size 1 must be on the diagonal and at first sight there is no lane of width 1. But, as long as you put all diagonal squares and then any square adjacent to the square of size 1, such a lane arises.
Your heatmap for size 1 is great!
Danila P.
@Oleg:
The includes got filtered:
Util.h
//#include [bits/stdc++.h] // not including all
#include [filesystem] // just include what's needed
#include [array] // just include what's needed
#include [mutex] // just include what's needed
:)
The includes got filtered:
Util.h
//#include [bits/stdc++.h] // not including all
#include [filesystem] // just include what's needed
#include [array] // just include what's needed
#include [mutex] // just include what's needed
:)
Lord Sméagol
@Oleg:
I removed my macros:
#define __tzcnt_u32(v) ((v) ? (_tzcnt_u32(v)) : (32))
#define __lzcnt32(v) ((v) ? (_lzcnt_u32(v)) : (32))
replacing them with simple inline code
Util.h
//#include // not including all
#include // just include what's needed
#include // just include what's needed
#include // just include what's needed
#if 1 // use safe localtime
struct tm buf; // use safe localtime
auto err = localtime_s(&buf, &cur_time); // use safe localtime
return std::put_time(&buf, "%F %T"); // use safe localtime
#else // use safe localtime
return std::put_time(std::localtime(&cur_time), "%F %T");
#endif // use safe localtime
State.h
changed _mm_set_epi8(0x80 to -0x80 to stop warnings
inline replacement:
//int i = __tzcnt_u32(mask); // for no BMI; without zero test, as not needed here
int i = _tzcnt_u32(mask); // for no BMI; without zero test, as not needed here
inline replacement:
//int last_idx_before_mid = 31 - __lzcnt32(off_mask); // for no BMI; without zero test, as not needed here
int last_idx_before_mid = _lzcnt_u32(off_mask); // for no BMI; without zero test, as not needed here
Solver.h
inline replacement:
//return ini.size(); // to stop warning
return (int)ini.size(); // to stop warning
inline replacement:
//const int dim = __tzcnt_u32(mask); // for no BMI; without zero test, as not needed here
const int dim = _tzcnt_u32(mask); // for no BMI; without zero test, as not needed here
I tried '9' runs: with asserts: 10:31, without: 10:18 (saved 2%)
A minute slower than the faulty version, but still not too bad for a 2013 (Q3) CPU :)
Lord Sméagol
@Oleg: Happy new year!
I just added this:
#if 0
int last_idx_before_mid = 31 - __lzcnt32(off_mask); // 31 - LZCNT ==> index of MSb
#else
// if off_mask can never be zero, no need for check to override BSR result
assert(off_mask);
// a '9' run didn't reveal any 0 [you would know for sure for other sizes]
// need unsigned long result
unsigned long last_idx_before_mid;
// get index of MSb [no need for adjustment if off_mask can never be zero]
_BitScanReverse(&last_idx_before_mid, off_mask);
#endif
a run of '9' now produces the correct result: 1,730,280 :)
Lord Sméagol
@Lord Sméagol: Hello and happy New Year!
9 minutes is cool!
The answer is wrong because of _lzcnt instruction, as you suspected, as turns out it works differently on different cpus: https://nextmovesoftware.com/blog/2017...
With this error, solutions having 1x1 square directly in the center are not counted.
I guess, gcc/clang do it correctly because I specify -march=native (so it checks cpu and generates correct instruction), and run where I compile. But it's a potential problem I probably need to add some assertions to the code.
Maybe on your hardware you can either use WSL and clang compiler, or set constexpr bool USE_SSE_QUADRANT_FILL=false, to fall back to slower.
You could also try to use BitScanReverse instead of __lzcnt, but it has different input/output so I'm not sure how hard would that be to fix it.
Oleg
@Oleg: I pulled your code into Visual Studio 2026 and dealt with some warnings:
The COLLAPSES initializer was easy: Use (char) for 0x80
I changed unsafe localtime to:
struct tm buf;
auto err = localtime_s(&buf, &cur_time);
return std::put_time(&buf, "%F %T");
I did a quick change of __tzcnt_u32, __lzcnt32 to use _tzcnt_u32, _lzcnt_u32
Setting the compiler to use AVX and optimize for speed.
An '8' run worked, so I tried '9'
And it found only 1,729,930 solutions!
I suspected _tzcnt_u32, _lzcnt_u32 might be causing it, so I covered that:
#define __tzcnt_u32(v) ((v) ? (_tzcnt_u32(v)) : (32)) // Match BMI : should return 32 for value 0
#define __lzcnt32(v) ((v) ? (_lzcnt_u32(v)) : (32)) // Match BMI : should return 32 for value 0
but it didn't fix it.
Anyway, I decided to test multi-threading.
First I hunted for the initial depth sweet spot:
>Puzzle_Oleg.exe run 9 8 24
>Puzzle_Oleg.exe run 9 9 24
...
>Puzzle_Oleg.exe run 9 18 24
>Puzzle_Oleg.exe run 9 19 24
And found that 15 was fastest. [It didn't like 19]
'9' run [with the 1,729,930 problem] on Xeon E5-2697-v2
12t: 11m 52s
24t: 9m 1s
so HyperThreading is helping by about 48%
Lord Sméagol
Add a Comment
2025-08-30
This week, I've been at Talking Maths in Public (TMiP) at the University of Warwick in near Coventry. TMiP is a conference for anyone involved
in—or interested in getting involved in—any sort of maths outreach, enrichment, or public engagement activity. It was really good, and I highly recommend coming to TMiP 2027... But
as I'm one of the organisers, I'm a little biased.
The Saturday morning at TMiP was filled with a choice of activities, including a puzzle hunt written by me.
At the start/end point of the puzzle hung, there was a locked box with a combination lock. In order to work out the combination for the lock, you needed to find some clues hidden around
Coventry and solve a few puzzles.
Every team taking part was given a copy of these instructions.
Some people attended TMiP virtually, so I also made a version of the puzzle hunt that included links to Google Street View and photos from which the necessary information could be obtained.
You can have a go at this at mscroggs.co.uk/coventry-trail/remote. For anyone who wants to try the puzzles without searching through virtual Coventry,
the numbers that you needed to find are:
- Clue #1: \(a\) is 1931.
- Clue #2: \(b\) is 1956.
- Clue #3: \(c\) is 1434.
- Clue #4: \(d\) is 1949.
- Clue #5: \(e\) is 1620.
The solutions to the puzzles and the final puzzle are below. If you want to try the puzzles for yourself, do that now before reading on.
Puzzle for clue #1
154 is equal to 50625. The hundreds digit of 154 is 6.
The difference between the first and second digits of the code is the hundreds digit of \(15^a\) (ie 151931).
Puzzle for clue #2
If you write the numbers from 1 to 10000 in a huge triangle like this:
| 1 | |||||
| 2 | 3 | 4 | |||
| 5 | 6 | 7 | 8 | 9 | 10 | 11 | 12 | 13 | ... |
... then 11 is written directly below 5. The second digit of the code is not the tens digit of the number written directly below \(b\) (ie directly below 1956).
Puzzle for clue #3
The area of largest quadrilateral that fits inside a circle with area 2π is 4.
The difference between the first and last digits of the code is the thousands digits of the area of the largest dodecagon that fits inside a circle with area \(c\)π (ie 1434π).
Puzzle for clue #4
There are 10 dominoes that can be made using the numbers 0 to 3 (inclusive):
| 0 | 0 |
| 0 | 1 |
| 0 | 2 |
| 0 | 3 |
| 1 | 1 |
| 1 | 2 |
| 1 | 3 |
| 2 | 2 |
| 2 | 3 |
| 3 | 3 |
The sum of all the numbers on all these dominoes is 30.
The difference between the largest and smallest digits in the code is the units digit of the sum of all the numbers
on all the dominoes that can be made using the numbers 0 to \(d\) (ie from 0 to 1949) (inclusive).
Puzzle for clue #5
The number \(n\) has \(e\) digits (ie 1620 digits). All of its digits are 9. The last digit of the code is the hundreds digit of the sum of all the digits of \(n^2\).
The final puzzle
The final puzzle involves using the answers to the five puzzles to find the four digit code that
opens the box (and the physical locked box that was in the Transport Museum on
Saturday.
The five clues to the final code are:
- Clue #1: The difference between the first and second digits of the code is 3.
- Clue #2: The second digit of the code is not 4.
- Clue #3: The difference between the first and last digits of the code is 4.
- Clue #4: The difference between the largest and smallest digits in the code is 5.
- Clue #5: The last digit of the code is 5.
(Click on one of these icons to react to this blog post)
You might also enjoy...

Comments
Comments in green were written by me. Comments in blue were not written by me.
Great to do remotely, thanks! I think there is a typo in your solution for clue 4 although final answer is correct. Last sum prior to answer should read 1951 x 1/2 x 1949 x 1950 I think.
Lizzie
Add a Comment
2025-06-08
This week, Joel Riley's Every 5×5 Nonogram website
has been doing the rounds. The website includes every nonogram on a 5 by 5 grid that's solvable
without using trial-and-error, and anyone who visits the site can help to solve them all.
At the time of writing, around a quarter of the puzzles have been solved, so if you want to
be part of solving them you'll need to be a bit quick. Be warned though, solving
them can be addictive.
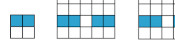
For the uninitiated, a nonogram is a puzzle where you have to colour in some of the squares so that the blocks of coloured squares in each row and column have the sizes given.
For example, this nongram:
)
... has this solution:
)
... because the first column contains one uninterrupted block of 5 black sqaures (5);
the second column contains two non-adjacent blocks of 1 black square (1 1); and so on. If a row or
column is empty, 0 is written in as its clue rather than leaving it blank.
After solving quite a few 5 by 5 nonograms, I started to wonder if I could make solvable nonograms that represented every letter of the alphabet.
Making letters
Making an alphabet of nonograms is harder than just drawing each letter, as not all 5 by 5 nonograms have a unique solution. For example, my first attempt to draw the letter X looked like this:
)
But this nonogram has a lot of solutions, including:
)
Checking that a 5×5 nonogram has a unique solution isn't too hard—you can do
this check by trying to solve it then seeing if you get to a point where there's more than one way
to finish—but it would be quite time consuming to do these for all 26 letters, so I wrote
a short Python script to do the checking for me. After a few minutes of tweaking some of the letters,
I had the alphabet.
Making words
Now that I had a nonogram for each letter of the alphabet, I had an idea: I could
use them to make wider nonograms (with a 0 column between them to prevent the letters touching).
Unfortunately, if two 5×5 nonograms both have
unique solutions, it doesn't necessarily follow that the wider nonogram made by putting them together
has a unique solution. For example, take the nonograms that were my first candidates for R and W:
)
There two nonograms both have a unique solution, but if you make a 5×11 nonogram by
placing them next to each other with a 0 column between them, you get a nonogram with multiple
solutions:
)
So my first attempt at the alphabet didn't give me a set of nonograms that I could use to spell
words. All was not lost though: after a bit of thinking I came up with an adjusted alphabet that
can be used to spell words and a justification for why any nonogram words built by putting these
letters in a rows will have a unique solution. These are the letters I ended up with:
)
If you'd like to make a nonogram for a word or your name, write it in the box below. You can click
on the nonogram that is creates to make it larger:
Why does this alphabet always make solvable words?
To show that this alphabet will always make solvable words, I first looked at every column of
every letter. For many column clues, there are squares that must always be black or always be white:
for example, if the column clue is 5, the squares must all be black; or if a column clue is 3, the
middle square in that column must be black. Looking at my alphabet, you can show that the black and
white squares in this diagram must be black or white, while the grey squares could still be either:
)
Next, suppose that the letter we're looking at is the leftmost letter in our nonogram, and consider the row clues.
We have to be a little bit careful here: we know that each row clue starts with the clue for the letter, but we don't know which numbers come next:
it could be possible to fit more or fewer of the row's black squares into the first letter.
Looking at the row clues carefully for each letter, we can add some more squares to our squares that we're certain are black or white (if our letter is leftmost):
)
We can now take another look at the columns using this new information, leading to:
)
And another look at the rows then the columns once again leave no grey squares:
)
Overall, this means that given any nonogram built from my alphabet, you can always solve the leftmost
letter. But if you then delete the first letter, you can solve for the second letter (as it's now the
first letter in the shorter nonogram). Then you can solve the third letter, and so on until you've
shown you can solve the full nonogram.
(Click on one of these icons to react to this blog post)
You might also enjoy...

Comments
Comments in green were written by me. Comments in blue were not written by me.
@Dave Budd: I would guess that it doesn't unless I got very lucky, but I should write a script and check...
Matthew
Nice argument for always solvable! I'm wondering if it also applies on a "2D" message, i.e. multiple rows of letters
Dave Budd
If you did numbers as well, you could make a meta nonogram, with the completed nonogram having numbers along the top and left, and gridlines. Or it could be a solved nonogram!×1 ×1
Boltí
Add a Comment
2025-03-17
This is an article that I wrote for
Chalkdust issue 21.
For ten years now, I've been setting the Chalkdust crossnumber. Over this time, I've developed a lot of tricks and tools for setting good puzzles.
Although puzzles involving words in grids of squares have been around since at least the 1800s, the first crossword (or word-cross as the author called it) puzzle was published in the New York World newspaper in 1913. Since this, crosswords have become a staple in newspapers and magazines around the world.
In the UK, cryptic crosswords were invented and grew in popularity in the 1900s and now appear in most newspapers and magazines. The cryptic crossword in the Listener magazine became infamous as the hardest such puzzle. the Listener ceased publication in 1991, but the Listener crossword still lives on and is now published on Saturdays in the Times newspaper.
)
Fun's word-cross puzzle, written by Arthur Wynne in 1913. Each clue gives the position of the first and last letters where the entry should be written. The puzzle features well-known words such as 'neif' and 'nard', and the solution includes 'dove' twice.
In early 2015, we were discussing ideas for regular content in our brand new maths magazine, and wanted to include a more mathematical crossword-style puzzle. Like Venus emerging from the shell, the crossnumber was born.
Of course, we didn't invent the crossnumber puzzle: the first known crossnumber puzzle was written by Henry Dudeney and published by Strand Magazine in 1926; four times a year, the Listener features a numerical puzzle; and the UKMT (United Kingdom Mathematics Trust) have included a crossnumber as part of their team challenge for many years. There are also plenty of other publications that include crossnumbers, including the very enjoyable Crossnumbers Quarterly, that's been publishing collections of the puzzles four times a year since 2016. But perhaps we'll be mentioned in a footnote in a book about the history of puzzles.
But anyway, we'd decided we needed a crossnumber, so I needed to write one...
Making a grid
The first step when creating a puzzle is to create the grid. Like many publications, we restrict ourselves to using grids of squares (for the main crossnumber at least---we allow more freedom in other puzzles that we feature).
)
Grids with order 2 (left) and order 4 (right) rotational symmetry.
Typically, a publication will impose some restrictions on the placement of the black squares in its puzzle. The most popular restrictions are:
- The white squares must be simply connected (for any two white squares, it is possible to draw a path between them that only goes through white squares);
- The arrangement of black squares must be in some way symmetric;
- The proportion of squares that are black cannot be too high.
)
Grids with one, two, and four lines of symmetry.
There are two forms of symmetry that are used in crossword grids: rotational symmetry and reflectional symmetry. Both order 2 (rotate the grid 180° and it looks the same) and order 4 (rotate the grid 90° and it looks the same) rotational symmetry are commonly used in crossword grids, with order 2 rotational symmetry often being the minimal allowable amount of symmetry. You'll want to be careful when making a grid with order 4 rotational symmetry, as it's very easy to make your grid into an accidental swastika.
)
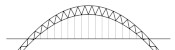
The grid for crossnumber #14 experimented with translational symmetry.
With a few notable exceptions, the grids for the Chalkdust crossnumber have some form of symmetry, and also follow the other two restrictions. We do, however, allow some flexibility on these restrictions if it allows us to use an interesting grid. For crossnumber #14 (shown on the left), we experimented with translational symmetry, leading to a grid that was not simply connected and with a greater than usual proportion of black squares. For crossnumbers #11 and #6, the grids had a nice property: rotating the grid leads to the same pattern of squares with the colours inverted. Once again we had to break the requirements on connectedness and the proportion of black squares to do this.
)
The grid for crossnumber #11. Rotating this grid 90° leads to the same grid with inverted colours. This grid also has order 2 rotational symmetry.
)
The grid for crossnumber #6. Rotating this grid 180° leads to the same grid with inverted colours.
)
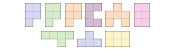
The grid for crossnumber #17 was not symmetric, and instead included all 18 pentominoes in black.
For crossnumber #17, we skipped imposing symmetry entirely and instead formed all 18 pentominoes from the black squares in the grid. This really pleased me, as there were clues in the puzzle related to the number of pentominoes and the number of black squares in the grid.
For American style crosswords, there's an additional restriction that is imposed: all white squares must be checked. A white square is called 'checked' if it is part of an across entry and a down entry---and so you can fill that square in by solving one of two different clues. Due to this, American crosswords will have large rectangles composed entirely of white squares and never have lines of alternating black and white squares as commonly seen in British puzzles.
)
A valid American crossword (if two letter entries were allowed
)
A valid British crossword that is not a valid American crossword
When writing a crossword, it is common to pick the words to include while making the grid, as trying to find valid words or phrases to fill a predetermined grid is a challenging task. (Thankfully, there's software out there that can help you make grids from a list of words.) For crossnumbers, filling the grid is a much easier task as any string of digits not starting with a zero is a valid entry. This ease of filling the grid is what allowed us to use the interesting restriction-breaking grids mentioned in this section.
For crosswords, it is also common to disallow the use of two-letter words. For the crossnumber, removing two-digit numbers would remove the potential for a lot of fun number puzzles, so we don't impose this restriction here. We allow two-letter words in the Chalkdust cryptic too, as they can be really useful when trying to make a grid with our additional restriction that the majority of the included words should be related to maths.
Setting the clues
Once I've made the grid for a crossnumber, the next task is to write the clues.
Often, I start this task by picking a fun mathematical or logic puzzle to include in the clues. Sometimes, this is a single clue, such as this one from crossnumber #1:
Down
6. This number's first digit tells you how many 0s are in this number, the second digit how many 1s, the third digit how many 2s, and so on. (10)
Or this clue from crossnumber #5:
Across
9. A number \(a\) such that the equation \(3x^2+ax+75\) has a repeated root. (2)
Other times, this could be a set of clues that refer to each other and reveal enough information to work out what one of the entries should be, such as these clues from crossnumber #10:
Across
13. 49A reversed. (3)
37. The difference between 49A and 13A. (3)
47. 37A reversed. (3)
48. The sum of 47A and 37A. (4)
49. Each digit of this number (except the first) is (strictly) less than the previous digit. (3)
Once I've included a few sets of clues like this, it's time to write the rest of the clues. As any crossnumber solvers will have noticed, my favourite type of clue to add from this point on is a clue that refers to another entry.
More recently, I've begun adding an additional mechanic to each crossnumber. This started in crossnumber #13, when all the clues involved two conditions which were joined by an and, or, xor, nand, nor or xnor connective. Mechanics in later puzzles have included the clues being given in a random order without clue numbers (#14), some clues being false (#16), and each clue being satisfied by both the entry and the entry reversed (#19). I really hope that you enjoy the 'fun' mechanic I used in this issue's puzzle.
Around the same time as I started playing with additional mechanics, my taste in puzzles shifted. Older crossnumbers had been quite computational, and often needed some programming for a few of the clues, but more recently I have become a greater fan of logic puzzles and number puzzles that can be solved by hand. To reflect the change in the type of puzzle I was setting we added the phrase 'but no programming should be necessary to solve the puzzle' to the instructions, starting with crossnumber #14.
Thinking like a mega-pedant
One of the most important things to watch out from when writing and checking clues is accidental ambiguity due to writing maths in words.
For example, the clue 'A factor of 6 more than 2D' could be read in two ways: this could be asking the solver to add 6 to 2D, then find a factor of the result; or it could be asking the solver to add 1, 2, 3, or 6 (ie a factor of 6) to 2D.
As long as I spot clues like this, it can usually be fixed with some rewording. In this example, I'd rewrite the clues as either '2D plus a factor of 6.' or 'This number is a factor of the sum of 6 and 2D.'
In my time setting the crossnumber, I've got a lot better at spotting ambiguity in clues, and do this by reading through the clues and trying to be a mega-pedant and intentionally misinterpret them. It can be really helpful to get someone else to help with this check though, as remembering what you intended to mean when writing a clue can make it hard to read them critically.
Checking uniqueness
Perhaps the most difficult part of setting a crossnumber is checking that there is exactly one solution to the completed puzzle.
To help with this task, I've written a load of Python code to help me find all the solutions to the puzzle. I run this a lot while writing clues to make sure there's no area of the puzzle where I've left multiple options for a digit. I intentionally use a lot of brute force in this code so that it's really good at catching situations where there are multiple answers to a puzzle where I only found one solution by hand.
Once I've got all the clues and my code says the solution is unique, I do a full solve of the puzzle by hand. This is both to confirm that the code's conclusion was not due to a bug, and to check that the difficulty of the puzzle is reasonable.
Following this checking, and a little proofreading, the puzzle is ready for publishing. Then the fun part begins, as I get to chill with a nice cup of tea and wait for people to submit their answers.
(Click on one of these icons to react to this blog post)
You might also enjoy...
Comments
Comments in green were written by me. Comments in blue were not written by me.
Add a Comment
Wish you a Merry Xmas and a Wonderful New Year !!!