
Blog
2024-02-20
Back in November, I wrote about making 2n-page zines.
Thanks to some conversations I had at Big MathsJam
in later November, I've been able to work out how many 128-page zines there are: 315434.
The insight
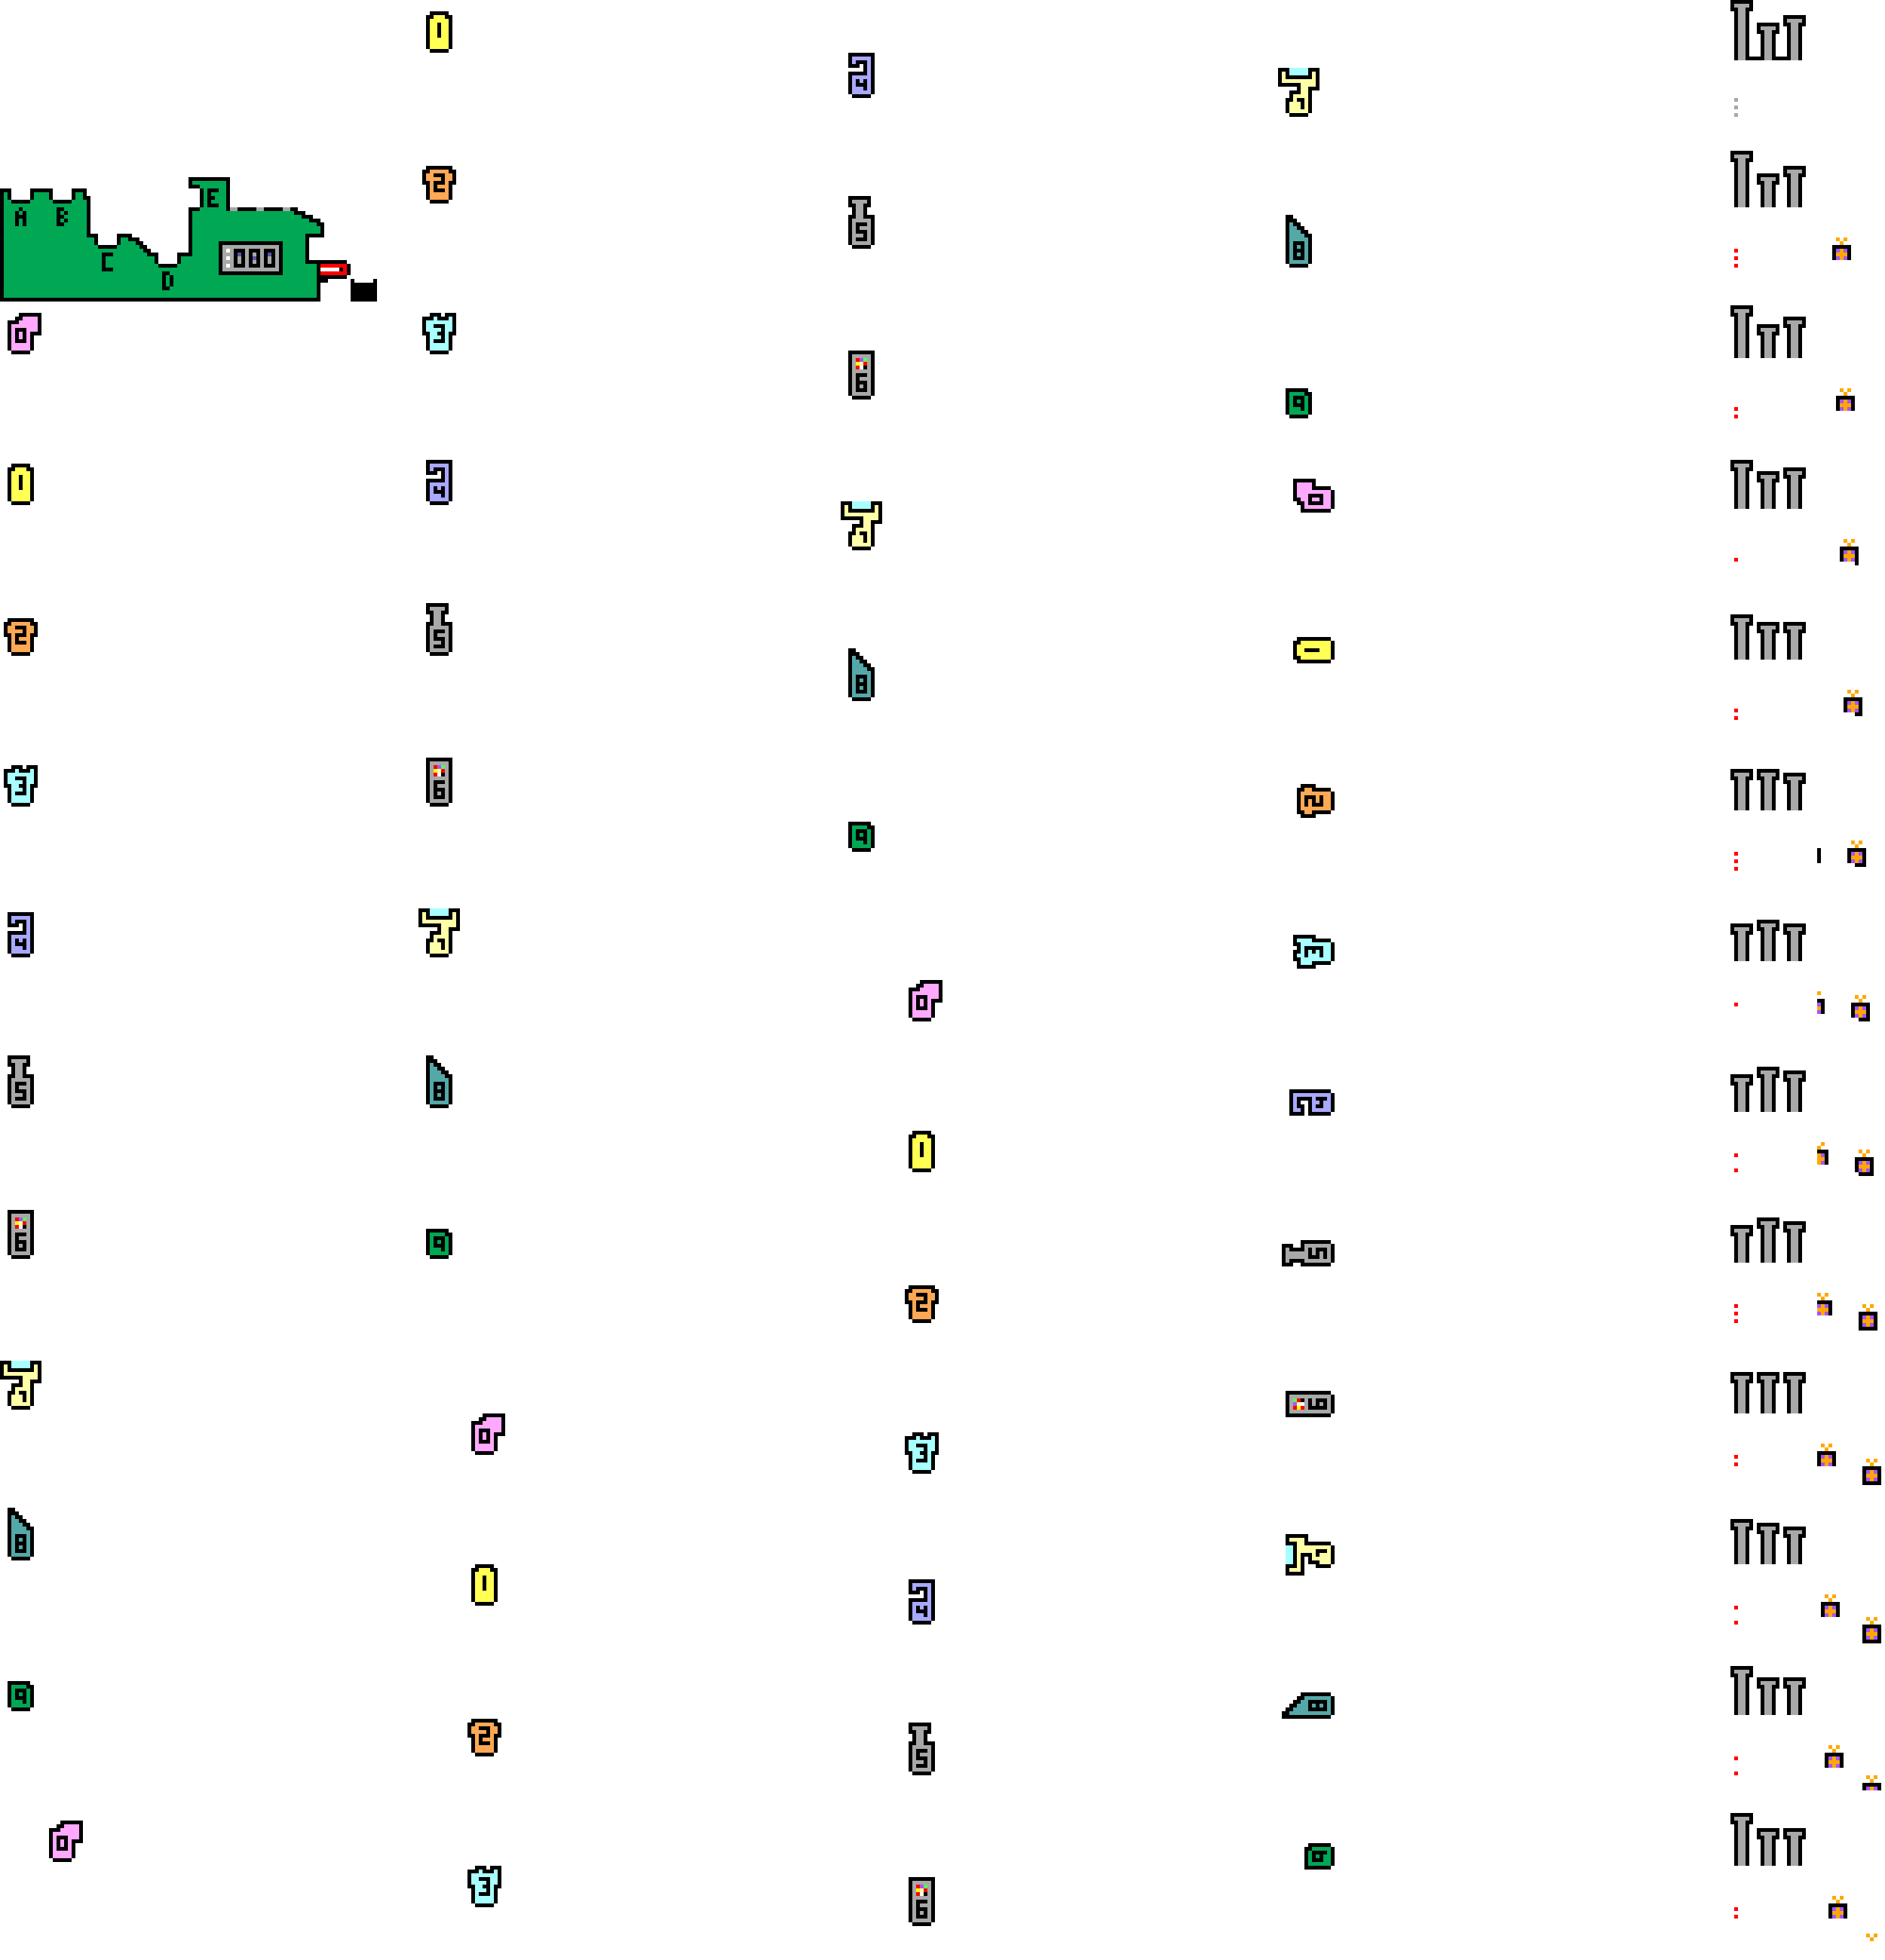
At Big MathsJam, Colin Beveridge pointed out
something he'd noticed about the possible zines: when drawing the line connecting the pages
in order, there were some line segments that were always included. For example, here are all of the possible
64-page zines:
)
Every single one of these includes these line segments:
)
Colin conjectured that for a zine of any size, a pattern like this of alternative horizontal segments
must always be included. He was close to justifying this, and since MathsJam I've been able to fill
in the full justificication.
The justificiation
First, consider the left-most column of pages. They must be connected like this:
)
If they were connected in any other way, there would be two vertical connections in a row,
which would create a page that is impossible to open (as every other connection must be a horizontal
that ends up in the spine). Additionally, the horizontal lines in this diagram must all be in the
spine (as otherwise we again get pages that cannot be opened).
Next, consider a horizontal line that's in the spine (shown in red below), and we can look
at all the possible ways to draw the line through the highlighted page, paying particular
attention to the dashed blue line:
)
The six possible ways in which the line could travel through the highlighted page are:
)
The three options in the top row do not give a valid zine: the leftmost diagram has two vertical
connections in a row (leading to pages that do not open). The other two diagrams in the top row
have the horizontal line that we know is in the spine, followed by a horizontal line not in the
spine, then a vertial line: this vertical line should be in the spine, but as it is vertical
it cannot be (without making a page that doesn't open).
In each of the diagrams in the bottom row, the connection shown in dashed blue
is included and must be in the spine: in the leftmost diagram, the horizontal line that we know is in the spine
is followed by a horizontal not in the spine, then the horizinal in the dashed blue position
that must therefore be in the spine. The othe other two diagrams in the bottom row,
the dashed blue position is connected to a vertical line: this means that the dashed blue connection
must be in the spine (as otherwise the vertical would cause a page that doesn't open).
Overall, we've now shown that the leftmost column of lines must always be included and
must all be in the spine; and for each horizontal line in the spine, the line to the right of it
after a single gap must also be included and in the spine. From this, it follows that all the horizontal
lines in Colin's pattern must always be included.
Calculating the number of 128-page zines
Now that I knew that all these horizonal lines are always included, I was able to update
the code I was using to find all the possible zines
to use this. After a few hours, it had found all 315434 possibilites. I was very happy to get this
total, as it was the same as the number that
Luna (another attendee of Big MathsJam) had calculated but wasn't certain was correct.
The sequence of the number of 2n-page zines,
including the newly calculated number,
is now published on the OEIS.
I think calculating number of 256-page zines is still beyond my code though...
(Click on one of these icons to react to this blog post)
You might also enjoy...


Comments
Comments in green were written by me. Comments in blue were not written by me.
Add a Comment
2024-01-07
Welcome to 2024 everyone! Now that the Advent calendar has disappeared, it's time to reveal the answers and announce the winners.
But first, some good news: with your help, the machine was fixed in time for Santa to deliver presents and Christmas was saved!
Now that the competition is over, the questions and all the answers can be found here.
Before announcing the winners, I'm going to go through some of my favourite puzzles from the calendar and a couple of other interesting bits and pieces.
Highlights
My first highlight is the puzzle from 4 December. I like this puzzle, because at first it looks really difficult, and the size of the factorial involved is impossibly large,
but the way of solving it that I used essentially just ignores the factorial leading to a much easier question.
4 December
If \(n\) is 1, 2, 4, or 6 then \((n!-3)/(n-3)\) is an integer. The largest of these numbers is 6.
What is the largest possible value of \(n\) for which \((n!-123)/(n-123)\) is an integer?
My next pair of highlights are the puzzles from 6 and 7 December. I always enjoy a surprise appearance of the Fibonacci sequence, and a double enjoyed a
double appearance in two contexts that at first look completely different.
6 December
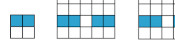
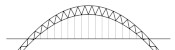
There are 5 ways to tile a 4×2 rectangle with 2×1 pieces:
)
How many ways are there to tile a 12×2 rectangle with 2×1 pieces?
7 December
There are 8 sets (including the empty set) that contain numbers from 1 to 4 that don't include any consecutive integers:
How many sets (including the empty set) are there that contain numbers from 1 to 14 that don't include any consecutive integers?
My next highlight is the puzzle from 13 December. I love a good crossnumber, and had a lot of fun making this small one up. (If you enjoyed this one, you should check out the
crossnumbers I write for Chalkdust.)
13 December
Today's number is given in this crossnumber. No number in the completed grid starts with 0.
|
|
| |||||||||||||||||||||||||||||||||
My final highlight is the puzzle from 22 December. I enjoy that you can use one of the circle theorems to solve this, despite there being no circles directly involved in the question.
22 December
There are 4 ways to pick three vertices of a regular quadrilateral so that they form a right-angled triangle:
)
In another regular polygon with \(n\) sides, there are 14620 ways to pick three vertices so that they form a right-angled triangle. What is \(n\)?
Hardest and easiest puzzles
Once you've entered 24 answers, the calendar checks these and tells you how many are correct. I logged the answers that were sent
for checking and have looked at these to see which puzzles were the most and least commonly incorrect. The bar chart below shows the total number
of incorrect attempts at each question.
| 1 | 2 | 3 | 4 | 5 | 6 | 7 | 8 | 9 | 10 | 11 | 12 | 13 | 14 | 15 | 16 | 17 | 18 | 19 | 20 | 21 | 22 | 23 | 24 |
| Day | |||||||||||||||||||||||
It looks like the hardest puzzles were on
23 and
12 December;
and the easiest puzzles were on
1,
3,
5, and
11 December.
Fixing the machine
To finish the Advent calendar, you were tasked with fixing the machine. The answers to all the puzzles were required to
be certain of which combination of parts were needed to fix the machine, but it was possible to reduce the number of options
to a small number and get lucky when trying these options. This graph shows how many people fixed the machine on each day:
| 15 | 16 | 17 | 18 | 19 | 20 | 21 | 22 | 23 | 24 | 25 | 26 | 27 | 28 | 29 | 30 |
| Day | |||||||||||||||
The winners
And finally (and maybe most importantly), on to the winners: 180 people managed to fix the machine. That's slightly fewer than last year:
| 2015 | 2016 | 2017 | 2018 | 2019 | 2020 | 2021 | 2022 | 2023 |
| Year | ||||||||
From the correct answers, the following 10 winners were selected:
- Matt Thomson
- Matthieu
- Steve Paget
- Millie
- Eleanor
- Alex Bolton
- Brennan Dolson
- UsrBinPRL
- Daniel Low
- Erik
Congratulations! Your prizes will be on their way shortly.
The prizes this year include 2023 Advent calendar T-shirts. If you didn't win one, but would like one of these, I've made them available to buy at merch.mscroggs.co.uk alongside the T-shirts from previous years.
Additionally, well done to
100118220919, Aaron, Adam NH, Aidan Dodgson, AirWrek, Alan Buck, Alejandro Villarreal, Alek2ander, Alex, Alex Hartz, Allan Taylor, Andrew Roy, Andrew Thomson, Andrew Turner, Andy Ennaco, Ashley Jarvis, Austin Antoniou, Becky Russell, Ben, Ben Boxall, Ben Reiniger, Ben Tozer, Ben Weiss, Bill Russ, Bill Varcho, Blake, Bogdan, Brian Wellington, Carl Westerlund, Carmen, Carnes Family, Cathy Hooper, Chris Eagle, Chris Hellings, Colin Brockley, Connors of York, Corbin Groothuis, Dan Colestock, Dan May, Dan Rubery, Dan Swenson, Dan Whitman, Daphne, David and Ivy Walbert, David Ault, David Berardo, David Fox, David Kendel, David Mitchell, Deborah Tayler, Diane, Donald Anderson, Duncan S, Dylan Madisetti, Ean, Elise Raphael, Emelie, Emily Troyer, Emma, Eric, Eric Kolbusz, Ewan, Frank Kasell, Fred Verheul, Gabriella Pinter, Gareth McCaughan, Gary M, Gary M. Gerken, George Witty, Gert-Jan, Grant Mullins, Gregory Wheeler, Guillermo Heras Prieto, Heerpal Sahota, Helen, Herschel, Iris Lasthofer, Ivan Molotkov, Jack, Jack H, Jacob Y, James Chapman, Jan Z, Jay N, Jean-Sébastien Turcotte, Jen Sparks, Jenny Forsythe, Jessica Marsh, Jim Ashworth, Joe Gage, Johan, Jon Palin, Jonathan Chaffer, Jonathan Thiele, Jorge del Castillo Tierz, K Brooks, Kai, Karen Climis, Kevin Docherty, Kevin Fray, Kirsty Fish, Kristen Koenigs, lacop, Lazar Ilic, Lewis Dyer, Lisa Stambaugh, Lise Andreasen, Lizzie McLean, Louis, Magnus Eklund, Marco van der Park, Mark Fisher, Mark Stambaugh, Martijn O., Martin Harris, Martin Holtham, Mary Cave, Matthew Schulz, Max, Merrilyn, Mihai Zsisku, Mike Hands, Miles Lunger, Mr J Winfield, Nadine Chaurand, Naomi Bowler, Nathan Whiteoak, Nick C, Nick Keith, Niji Ranger, Pamela Docherty, Pierce R, Qaysed, Rashi, Ray Arndorfer, rea, Reuben Cheung, Riccardo Lani, Richard O, Rob Reynolds, Robby Brady, Roger Lipsett, Roni, Rosie Paterson, RunOnFoot, Ruth Franklin, Ryan Wise, Sage Robinson, Sam Dreilinger, Sarah, Scott, Sean Henderson, Seth Cohen, Shivanshi, Shreevatsa, Stephen Cappella, Steve Blay, TAS, Tehnuka, The Johnston Family, Tina, Tony Mann, Trent Marsh, tripleboleo, Valentin VĂLCIU, Vinny R, William Huang, Yasha, and Yuliya Nesterova,
who all also completed the Advent calendar but were too unlucky to win prizes this time or chose to not enter the prize draw.
See you all next December, when the Advent calendar will return.
(Click on one of these icons to react to this blog post)
You might also enjoy...


Comments
Comments in green were written by me. Comments in blue were not written by me.
In your solution for the 12th, I think there's still a little work to do: to check that the answer is the smallest integer that works. For that, because 241 is prime, you only have a handful of values to check. ×4 ×4 ×4 ×4 ×4
Ben Reiniger
(you've left the "drones" in at the beginning of the Winners section)×2 ×2 ×3 ×1 ×2
Ben Reiniger
On the 6th and 7th, there's also a direct bijection: in the tiling, horizontal tiles must occur in aligned pairs (else they split left/right into odd number of 1x1 blocks). Encode a tiling with the set of horizontal locations of the left ends of the horizontal-tile-pairs.×2 ×2 ×2 ×2 ×2
Ben Reiniger
Add a Comment
2023-12-08
In November, I spent some time (with help from TD) designing this year's Chalkdust puzzle Christmas card.
)
The card looks boring at first glance, but contains 10 puzzles. By colouring in the answers to the puzzles on the front of the card in the colours given (each answer appears four time),
you will reveal a Christmas themed picture.
If you're in the UK and want some copies of the card to send to your maths-loving friends, you can order them at mscroggs.co.uk/cards.
If you want to try the card yourself, you can download this printable A4 pdf. Alternatively, you can find the puzzles below and type the answers in the boxes. The answers will automatically be found and coloured in...
Green | ||
| 1. | What is the largest value of \(n\) such that \((n!-1)/(n-1)\) is an integer? | Answer |
| 2. | What is the largest value of \(n\) such that \((n!-44)/(n-44)\) is an integer? | Answer |
Red/blue | ||
| 3. | Holly adds up the first 7 even numbers, then adds on half of the next even number. What total does she get? | Answer |
| 4. | Holly adds up the first \(n\) even numbers, then adds on half of the next even number. Her total was 9025. What is \(n\)? | Answer |
Brown | ||
| 5. | What is the area of the quadrilateral with the largest area that will fit inside a circle with area 20π? | Answer |
| 6. | What is the area of the dodecagon with the largest area that will fit inside a circle with area 20π? | Answer |
| 7. | How many 3-digit positive integers are there whose digits are all 1, 2, 3, 4, or 5 with exactly two digits that are ones? | Answer |
| 8. | Eve works out that there are 300 \(n\)-digit positive integers whose digits are all 1, 2, 3, 4, or 5 with exactly \(n-1\) digits that are ones. What is \(n\)? | Answer |
| 9. | What are the last two digits of \(7^3\)? | Answer |
| 10. | What are the last two digits of \(7^{9876543210}\)? | Answer |
(Click on one of these icons to react to this blog post)
You might also enjoy...

Comments
Comments in green were written by me. Comments in blue were not written by me.
Incorrect answers are treated is correct.
Looking at the JavaScript code, I found that any value that is a key in the array "regions" is treated as correct for all puzzles.×4 ×4 ×4 ×4 ×4
Looking at the JavaScript code, I found that any value that is a key in the array "regions" is treated as correct for all puzzles.
Lars Nordenström
My visual abilities fail me - managed to solve the puzzles but cannot see what the picture shows×4 ×4 ×4 ×4 ×4
Gantonian
how can a dodecagon with an area of 88 fit inside anything with an area of 62.83~?×4 ×4 ×4 ×4 ×2
nochum
Add a Comment
2023-11-22
This year, the front page of mscroggs.co.uk will once again feature an Advent calendar, just like
in each of the last eight years.
Behind each door, there will be a puzzle with a three digit solution. The solution to each day's puzzle forms part of a logic puzzle:
It's nearly Christmas and something terrible has happened: a machine in Santa's toy factory has malfunctioned, and is unable to finish building all
the presents that Santa needs.
You need to help Santa work out how to fix the broken machine so that he can build the presents and deliver them before Christmas is ruined for everyone.
Inside the broken machine, there were five toy production units (TPUs) installed at sockets labelled A to E. During the malfunction, these TPUs were
so heavily damaged that Santa is unable to identify which TPU they were when trying to fix the machine. The company that supplies TPUs builds 10 different units, numbered from 0 to 9.
You need to work out which of the 10 TPUs needs to be installed in each of the machine's sockets, so that Santa can fix the machine. It may be that two or more of the TPUs are the same.
Behind each day (except Christmas Day), there is a puzzle with a three-digit answer. Each of these answers forms part of a clue about the machine's TPUs.
You must use these clues to work out which TPU to install in each socket.
You can use this page to plug in five TPUs and test the machine. It takes a significant amount of Santa's time to test the machine, so you
can only run a very small number of tests each day.
Ten randomly selected people who solve all the puzzles, fix the machine, and fill in the entry form behind the door on the 25th will win prizes!
)
The prizes will include an mscroggs.co.uk Advent 2023 T-shirt. If you'd like one of the T-shirts from a previous Advent, they are available to order at merch.mscroggs.co.uk.
The winners will be randomly chosen from all those who submit the entry form before the end of 2023. Each day's puzzle (and the entry form on Christmas Day) will be available from 5:00am GMT. But as the winners will be selected randomly,
there's no need to get up at 5am on Christmas Day to enter!
As you solve the puzzles, your answers will be stored. To share your stored answers between multiple devices, enter your email address below the calendar and you will be emailed a magic link to visit on your other devices.
To win a prize, you must submit your entry before the end of 2023. Only one entry will be accepted per person. If you have any questions, ask them in the comments below,
on Twitter,
or on Mastodon.
So once December is here, get solving! Good luck and have a very merry Christmas!
(Click on one of these icons to react to this blog post)
You might also enjoy...
Comments
Comments in green were written by me. Comments in blue were not written by me.
Thank you Matthew. 23rd was my favourite puzzle as the cuisenaire rods helped me and I worked with my son to get a final answer. Happy New Year. ×1 ×2 ×1 ×1
Jenny
I really like 22, and will be using it with my top set Year 10s when I do circle theorems next term :)×7 ×6 ×6 ×7 ×6
Artie Smith
I love doing your puzzles, your advent ones as well as the Chalkdust Crossnumbers - thank you!×9 ×8 ×8 ×8 ×8
Merrilyn
Add a Comment
2023-11-03
I showed off an unfinished version of the content in this blog post in the first
Finite Group live stream in October. I'll be showing off other upcoming things and other
content at future Finite Group events. If you'd like to watch this, you can sign up to our Patreon at
finitegroup.co.uk.
A few months ago at Cheltenham Science Festival, Hana Ayoob showed me how to make an 8-page zine.
If you've not make one before, I recommend following these steps now.
Take a piece of A4 paper, and fold it 3 times like this:
)
Unfold all the folds except the first one and cut along the red line:
)
After unfolding, your paper should look like this:
)
Fold the paper in half the other way:
)
Push the two ends of the paper together so that the front of the middle bit of paper comes forward,
and the back goes backward:
)
Finally, flatten all the pages and you have your zine:
)
You're now free to write or draw whatever you like on the 8 pages of your zine.
If you'd like to fold a zine that already has content printed on it, you can
print the instructions for the TMiP puzzle hunt that I wrote earlier this year, or you can print this blog post off in zine format.
A 16-page zine
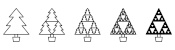
If you're anything like me, you'll already be wondering if it's possible to do some more folding
and cutting to make a 16-page zine from a piece of A4. After some trial and error, I found that
you can if you fold the paper 4 times then cut along these red lines:
)
(This time, I've drawn the diagram with a portrait piece of paper, as this leads to a portrait zine. For an 8-page zine, a landscape piece of paper led to a portrait zine.)
Instead of drawing which lines we need to cut, we can represent our two zines so far by drawing
lines that connect the pages in order:
)
During my experimentation, I saw that every second connection between pages must be horizontal.
These horizontal connections end up in the spine of the zine and allow the pages to turn.
If you can't visualise why the pages won't turn if this condition doesn't hold, try making a 16-page
zine like this:
)
32-page zines
Now that we can make a 16-page zine, the obvious question is: can we make a 32-page zine?
To answer this, we need to look for lines that go through all
32 pages where every second connection is a horizontal. I wrote a Python script to look for these and it
found 3:
)
The code also told me that the 8- and 16-page zines we know about are the only 8- and 16-page
zines. I'm only counting the zines where the pages in the final zine are portrait, and have the same side ratio a the original piece of A4 paper:
there will be other possible zines where the pages are landscape that we aren't counting.
2n-page zines
Now that we have 8-page, 16-page, and 32-page zines, we can look for patterns that we
can generalise to make a 2n-page zine. This generalisation was the first I
came up with:
)
One possible 2n-page zine for n=3 to 12 (click to enlarge)
There are, of course, many other generalisations that you could come up with.
How many zines?
While working towards our generalised zine, you may have started pondering another question:
for any given n, how many different 2n-page zines can be made?
For n=2, there's only one way to make a zine (fold the paper twice).
For n=3 to 6, we've already seen that there are 1, 1, and 3 ways to make zines. The code
I wrote was also able to tell me that there are 31 possible 64-page zines:
All 31 possible 64-page zines (click to enlarge)
So the start of the sequence of the number of possible zines is: 1, 1, 1, 3, 31.
The number of different possible paths to check increases very quickly as we increase
n, so I was unable to compute the next term in a reasonable amount of time.
I've submitted this sequence to the OEIS. Let's
hope someone is able to work out the next term. If you're that someone, let me know!
(Click on one of these icons to react to this blog post)
You might also enjoy...

Comments
Comments in green were written by me. Comments in blue were not written by me.
This is hilarious. I was looking up ways to fold zines beyond the typical 8-pager and found this. Thanks for the laughs. I will test some of these out tomorrow.×1
Lou
Add a Comment