
Blog
2020-05-15
This is a post I wrote for The Aperiodical's Big Lock-Down Math-Off. You can vote for (or against) me here until 9am on Sunday...
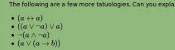
Recently, I came across a surprising fact: if you take any quadrilateral and join the midpoints of its sides, then you will form a parallelogram.
)
The blue quadrilaterals are all parallelograms.
The first thing I thought when I read this was: "oooh, that's neat." The second thing I thought was: "why?" It's not too difficult to show why this is true; you might like to pause here and try to work out why yourself before reading on...
To show why this is true, I started by letting \(\mathbf{a}\), \(\mathbf{b}\), \(\mathbf{c}\) and \(\mathbf{d}\) be the position vectors of the vertices of our quadrilateral. The position vectors of the midpoints of the edges are the averages of the position vectors of the two ends of the edge, as shown below.
)
)
The position vectors of the corners and the midpoints of the edges.
We want to show that the orange and blue vectors below are equal (as this is true of opposite sides of a parallelogram).
)
We can work these vectors out: the orange vector is$$\frac{\mathbf{d}+\mathbf{a}}2-\frac{\mathbf{a}+\mathbf{b}}2=\frac{\mathbf{d}-\mathbf{b}}2,$$
and the blue vector is$$\frac{\mathbf{c}+\mathbf{d}}2-\frac{\mathbf{b}+\mathbf{c}}2=\frac{\mathbf{d}-\mathbf{b}}2.$$
In the same way, we can show that the other two vectors that make up the inner quadrilateral are equal, and so the inner quadrilateral is a parallelogram.
Going backwards
Even though I now saw why the surprising fact was true, my wondering was not over. I started to think about going backwards.
It's easy to see that if the outer quadrilateral is a square, then the inner quadrilateral will also be a square.
)
If the outer quadrilateral is a square, then the inner quadrilateral is also a square.
It's less obvious if the reverse is true: if the inner quadrilateral is a square, must the outer quadrilateral also be a square? At first, I thought this felt likely to be true, but after a bit of playing around, I found that there are many non-square quadrilaterals whose inner quadrilaterals are squares. Here are a few:
)
A kite, a trapezium, a delta kite, an irregular quadrilateral and a cross-quadrilateral whose innner quadrilaterals are all a square.
There are in fact infinitely many quadrilaterals whose inner quadrilateral is a square. You can explore them in this Geogebra applet by dragging around the blue point:
As you drag the point around, you may notice that you can't get the outer quadrilateral to be a non-square rectangle (or even a non-square parallelogram). I'll leave you to figure out why not...
(Click on one of these icons to react to this blog post)
You might also enjoy...


Comments
Comments in green were written by me. Comments in blue were not written by me.
Add a Comment
2020-05-03
This is a post I wrote for The Aperiodical's Big Lock-Down Math-Off. You can vote for (or against) me here until 9am on Tuesday...
A few years ago, I made @mathslogicbot, a Twitter bot that tweets logical tautologies.
The statements that @mathslogicbot tweets are made up of variables (a to z) that can be either true or false, and the logical symbols
\(\lnot\) (not), \(\land\) (and), \(\lor\) (or), \(\rightarrow\) (implies), and \(\leftrightarrow\) (if and only if), as well as brackets.
A tautology is a statement that is always true, whatever values are assigned to the variables involved.
To get an idea of how to interpret @mathslogicbot's statements, let's have a look at a few tautologies:
\(( a \rightarrow a )\). This says "a implies a", or in other words "if a is true, then a is true". Hopefully everyone agrees that this is an always-true statement.
\(( a \lor \lnot a )\). This says "a or not a": either a is true, or a is not true
\((a\leftrightarrow a)\). This says "a if and only if a".
\(\lnot ( a \land \lnot a )\). This says "not (a and not a)": a and not a cannot both be true.
\(( \lnot a \lor \lnot \lnot a )\). I'll leave you to think about what this one means.
(Of course, not all statements are tautologies. The statement \((b\land a)\), for example, is not a tautology as is can be true or false depending on the
values of \(a\) and \(b\).)
While looking through @mathslogicbot's tweets, I noticed that a few of them are interesting, but most are downright rubbish.
This got me thinking: could I get rid of the bad tautologies like these, and make a list of just the "interesting" tautologies. To do this, we first need to
think of different ways tautologies can be bad.
Looking at tautologies the @mathslogicbot has tweeted, I decided to exclude:
- tautologies like \((a\rightarrow\lnot\lnot\lnot\lnot a)\) that contain more than one \(\lnot\) in a row.
- tautologies like \(((a\lor\lnot a)\lor b)\) that contain a shorter tautology. Instead, tautologies like \((\text{True}\lor b)\) should be considered.
- tautologies like \(((a\land\lnot a)\rightarrow b)\) that contain a shorter contradiction (the opposite of a tautology). Instead, tautologies like \((\text{False}\rightarrow b)\) should be considered.
- tautologies like \((\text{True}\lor\lnot\text{True})\) or \(((b\land a)\lor\lnot(b\land a)\) that are another tautology (in this case \((a\lor\lnot a)\)) with a variable replaced with something else.
- tautologies containing substatements like \((a\land a)\), \((a\lor a)\) or \((\text{True}\land a)\) that are equivalent to just writing \(a\).
- tautologies that contain a \(\rightarrow\) that could be replaced with a \(\leftrightarrow\), because it's more interesting if the implication goes both ways.
- tautologies containing substatements like \((\lnot a\lor\lnot b)\) or \((\lnot a\land\lnot b)\) that could be replaced with similar terms (in these cases \((a\land b)\) and \((a\lor b)\) respectively) without the \(\lnot\)s.
- tautologies that are repeats of each other with the order changed. For example, only one of \((a\lor\lnot a)\) and \((\lnot a\lor a)\) should be included.
After removing tautologies like these, some of my favourite tautologies are:
- \(( \text{False} \rightarrow a )\)
- \(( a \rightarrow ( b \rightarrow a ) )\)
- \(( ( \lnot a \rightarrow a ) \leftrightarrow a )\)
- \(( ( ( a \leftrightarrow b ) \land a ) \rightarrow b )\)
- \(( ( ( a \rightarrow b ) \leftrightarrow a ) \rightarrow a )\)
- \(( ( a \lor b ) \lor ( a \leftrightarrow b ) )\)
- \(( \lnot ( ( a \land b ) \leftrightarrow a ) \rightarrow a )\)
- \(( ( \lnot a \rightarrow b ) \leftrightarrow ( \lnot b \rightarrow a ) )\)
You can find a list of the first 500 "interesting" tautologues here. Let me know on Twitter
which is your favourite. Or let me know which ones you think are rubbish, and we can further refine the list...
(Click on one of these icons to react to this blog post)
You might also enjoy...
Comments
Comments in green were written by me. Comments in blue were not written by me.
Add a Comment
2019-07-03
This year's Big Internet Math-Off
is now underway with 15 completely new contestants (plus one returning contender). As I'm not the returning contestant, I haven't been spending
my time preparing my pitches. Instead, I've spent my time making an
unofficial Big Internet Math-Off sticker book.
To complete the sticker book, you will need to collect 162 different stickers. Every day, you will be given a pack of 5 stickers; there are
also some bonus packs available if you can find them (Hint: keep reading).
How many stickers will I need?
Using the same method as I did for last year's World Cup sticker book,
you can work out that the expected number of stickers needed to finish the sticker book:
If you have already stuck \(n\) stickers into your album, then the probability that the next sticker you get is new is
$$\frac{162-n}{162}.$$
The probability that the second sticker you get is the next new sticker is
$$\mathbb{P}(\text{next sticker is not new})\times\mathbb{P}(\text{sticker after next is new})$$
$$=\frac{n}{162}\times\frac{162-n}{162}.$$
Following the same method, we can see that the probability that the \(i\)th sticker you buy is the next new sticker is
$$\left(\frac{n}{162}\right)^{i-1}\times\frac{162-n}{162}.$$
Using this, we can calculate the expected number of stickers you will need to buy until you find a new one:
$$\sum_{i=1}^{\infty}i \left(\frac{162-n}{162}\right) \left(\frac{n}{162}\right)^{i-1} = \frac{162}{162-n}$$
Therefore, to get all 162 stickers, you should expect to buy
$$\sum_{n=0}^{161}\frac{162}{162-n} = 918 \text{ stickers}.$$
Using just your daily packs, it will take you until the end of the year to collect this many stickers.
Of course, you'll only need to collect this many if you don't swap your duplicate stickers.
How many stickers will I need if I swap?
To work out the expected number of stickers stickers you'd need if you swap, let's first think about two people who want to complete
their stickerbooks together. If there are \(a\) stickers that both collectors need and \(b\) stickers that one collector has and the other one
needs, then let \(E_{a,b}\) be the expected number of stickers they need to finish their sticker books.
The next sticker they get could be one of three things:
- A sticker they both need (with probability \(\frac{a}{162}\));
- A sticker one of them needs (with probability \(\frac{b}{162}\));
- A sticker they both have (with probability \(\frac{162-a-b}{162}\)).
Therefore, the expected number of stickers they need to complete their sticker books is
$$E_{a,b}=1+\frac{a}{162}E_{a-1,b+1}+\frac{b}{162}E_{a,b-1}+\frac{162-a-b}{162}E_{a,b}.$$
This can be rearranged to give
$$E_{a,b}=
\frac{162}{a+b}+
\frac{a}{a+b}E_{a-1,b+1}
+\frac{b}{a+b}E_{a,b-1}
$$
We know that $E_{0,0}=0$ (as if \(a=0\) and \(b=0\), both collectors have already finished their sticker books). Using this and the
formula above, we can work out that
$$E_{0,1}=162+E_{0,0}=162$$
$$E_{1,0}=162+E_{0,1}=324$$
$$E_{0,2}=\frac{162}2+E_{0,1}=243$$
$$E_{1,1}=\frac{162}2+\frac12E_{0,2}+\frac12E_{1,0}=364.5$$
... and so on until we find that \(E_{162,0}=1269\), and so our collectors should expect to collect 634 stickers each to complete their
sticker books.
For three people, we can work out that if there are \(a\) stickers that all three need, \(b\) stickers that two need, and \(c\) stickers
that one needs, then
$$
E_{a,b,c}
= \frac{162}{a+b+c}+
\frac{a}{a+b+c}E_{a-1,b+1,c}
+\frac{b}{a+b+c}E_{a,b-1,c+1}
+\frac{c}{a+b+c}E_{a,b,c-1}.
$$
In the same way as for two people, we find that \(E_{162,0,0}=1572\), and so our collectors should expect to collect 524 stickers each
to complete their sticker books.
Doing the same thing for four people gives an expected 463 stickers required each.
After four people, however, the Python code I wrote to do these calculations takes too long to run, so instead I approximated the numbers
by simulating 500 groups of \(n\) people collecting stickers, and taking the average number of stickers they needed. The results are shown in
the graph below.
)
The red dots are the expected values we calculated exactly, and the blue crosses are the simulated values.
It looks like you'll need to collect at least 250 stickers to finish the album: in order to get this many before the end of the Math-Off,
you'll need to find 20 bonus packs...
Of course, these are just the mean values and you could get lucky and need fewer stickers. The next graph shows box plots with the
quartiles of the data from the simulations.
)
So if you're lucky, you could complete the album with fewer stickers or fewer friends.
As a thank you for reading to the end of this blog post, here's a link that
will give you two bonus packs and help you on your way to the 250 expected stickers...
(Click on one of these icons to react to this blog post)
You might also enjoy...

Comments
Comments in green were written by me. Comments in blue were not written by me.
Link to sticker book, in the first paragraph, does not work. It points to mathoffstickbook.com
Pat Ashforth
minor typo for the 2 collector case
> and so our collectors should expect to collect 364 stickers
should be 634.
> and so our collectors should expect to collect 364 stickers
should be 634.
Road
Add a Comment
2018-09-13
This is a post I wrote for round 2 of The Aperiodical's Big Internet Math-Off 2018. As I went out in round 1 of the Big Math-Off, you got to read about the real projective plane instead of this.
Polynomials are very nice functions: they're easy to integrate and differentiate, it's quick to calculate their value at points, and they're generally friendly to deal with. Because of this, it can often be useful to find a polynomial that closely approximates a more complicated function.
Imagine a function defined for \(x\) between -1 and 1. Pick \(n-1\) points that lie on the function. There is a unique degree \(n\) polynomial (a polynomial whose highest power of \(x\) is \(x^n\)) that passes through these points. This polynomial is called an interpolating polynomial, and it sounds like it ought to be a pretty good approximation of the function.
So let's try taking points on a function at equally spaced values of \(x\), and try to approximate the function:
$$f(x)=\frac1{1+25x^2}$$
)
Polynomial interpolations of \(\displaystyle f(x)=\frac1{1+25x^2}\) using equally spaced points
I'm sure you'll agree that these approximations are pretty terrible, and they get worse as more points are added. The high error towards 1 and -1 is called Runge's phenomenon, and was discovered in 1901 by Carl David Tolmé Runge.
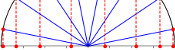
All hope of finding a good polynomial approximation is not lost, however: by choosing the points more carefully, it's possible to avoid Runge's phenomenon. Chebyshev points (named after Pafnuty Chebyshev) are defined by taking the \(x\) co-ordinate of equally spaced points on a circle.
)
Eight Chebyshev points
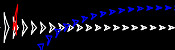
The following GIF shows interpolating polynomials of the same function as before using Chebyshev points.
)
Nice, we've found a polynomial that closely approximates the function... But I guess you're now wondering how well the Chebyshev interpolation will approximate other functions. To find out, let's try it out on the votes over time of my first round Big Internet Math-Off match.
)
Scroggs vs Parker, 6-8 July 2018
The graphs below show the results of the match over time interpolated using 16 uniform points (left) and 16 Chebyshev points (right). You can see that the uniform interpolation is all over the place, but the Chebyshev interpolation is very close the the actual results.
)
)
Scroggs vs Parker, 6-8 July 2018, approximated using uniform points (left) and Chebyshev points (right)
But maybe you still want to see how good Chebyshev interpolation is for a function of your choice... To help you find out, I've wrote @RungeBot, a Twitter bot that can compare interpolations with equispaced and Chebyshev points.
Since first publishing this post, Twitter's API changes broke @RungeBot, but it lives on on Mathstodon: @RungeBot@mathstodon.xyz.
Just tweet it a function, and it'll show you how bad Runge's phenomenon is for that function, and how much better Chebysheb points are.
For example, if you were to toot "@RungeBot@mathstodon.xyz f(x)=abs(x)", then RungeBot would reply: "Here's your function interpolated using 17 equally spaced points (blue) and 17 Chebyshev points (red). For your function, Runge's phenomenon is terrible."
)
A list of constants and functions that RungeBot understands can be found here.
(Click on one of these icons to react to this blog post)
You might also enjoy...
Comments
Comments in green were written by me. Comments in blue were not written by me.
Hi Matthew, I really like your post. Is there a benefit of using chebyshev spaced polynomial interpolation rather than OLS polynomial regression when it comes to real world data? It is clear to me, that if you have a symmetric function your approach is superior in capturing the center data point. But in my understanding in your vote-example a regression minimizing the residuals would be preferrable in minimizing the error. Or do I miss something?
Benedikt
Add a Comment
2018-07-06
This is a post I wrote for round 1 of The Aperiodical's Big Internet Math-Off 2018, where Mathsteroids lost to MENACE.
A map projection is a way of representing the surface of a sphere, such as the Earth, on a flat surface. There is no way to represent all the features of a sphere on a flat surface, so if you want a map that shows a certain feature of the world, then you map will have to lose some other feature of the world in return.
To show you what different map projections do to a sphere, I have created a version of the game Asteroids on a sphere. I call it Mathsteroids. You can play it here, or follow the links below to play on specific projections.
Mercator projection
The most commonly used map projection is the Mercator projection, invented by Gerardus Mercator in 1569. The Mercator projection preserves angles: if two straight lines meet at an angle \(\theta\) on a sphere, then they will also meet at an angle \(\theta\) on the map. Keeping the angles the same, however, will cause the straight lines to no longer appear straight on the map, and the size of the same object in two different place to be very different.
The angle preserving property means that lines on a constant bearing (eg 030° from North) will appear straight on the map. These constant bearing lines are not actually straight lines on the sphere, but when your ship is already being buffeted about by the wind, the waves, and the whims of drunken sailors, a reasonably straight line is the best you can expect.
The picture below shows what three ships travelling in straight lines on the sphere look like on a Mercator projection.
)
To fully experience the Mercator projection, you can play Mathsteroids in Mercator projection mode here. Try flying North to see your spaceship become huge and distorted.
Gall–Peters projection
The Gall–Peters projection (named after James Gall and Arno Peters) is an area-preserving projection: objects on the map will have the same area as objects on the sphere, although the shape of the object on the projection can be very different to its shape on the sphere.
The picture below shows what three spaceships travelling in straight lines on a sphere look like on the Gall–Peters projection.
)
You can play Mathsteroids in Gall–Peters projection mode here. I find this one much harder to play than the Mercator projection, as the direction you're travelling changes in a strange way as you move.
Azimuthal projection
)
The emblem of the UN
An azimuthal projection makes a map on which the directions from the centre point to other points on the map are the same as the directions on the sphere. A map like this could be useful if, for example, you're a radio operator and need to quickly see which direction you should point your aerial to communicate with other points on the map.
The azimuthal projection I've used in Mathsteroids also preserves distances: the distance from the centre to the another points on the map is proportional to the actual distance on the sphere. This projection is used as the emblem of the UN.
The picture below shows three straight lines on this projection. You can play Mathsteroids in azimuthal mode here.
)
Craig retroazimuthal projection
A retroazimuthal projection makes a map on which the directions to the centre point from other points on the map are the same as the directions on the sphere. If you're thinking that this is the same as the azimuthal projection, then you're too used to doing geometry on flat surfaces: on a sphere, the sum of the angles in a triangle depends on the size of the triangle, so the directions from A to B and from B to A aren't as closely related as you would expect.
The Craig retroazimuthal projection was invented by James Ireland Craig in 1909. He used Mecca as his centre point to make a map that shows muslims across the world which direction they should face to pray.
The picture below shows what three spaceships travelling in a straight lines on a sphere looks like on this projection.
)
You can play Mathsteroids in Craig retroazimuthal mode here to explore the projection yourself. This is perhaps the hardest of all to play, as (a) two different parts of the sphere overlap on the map, and (b) the map is actually infinitely tall, so quite a bit of it is off the edge of the visible game area.
Stereographic projection
The final projection I'd like to show you is the stereographic projection.
Imagine that a sphere is sitting on a 2D plane. Take a point on the sphere. Imagine a straight line through this point and the point at the top of the sphere. The point where this line meets the 2D plane is stereographic projection of the point on the sphere.
)
The stereographic projection
This projection (backwards) can be used to represent the every complex number as a point on a sphere: this is called the Riemann sphere.
To make Mathseteroids playable after this projection, I split the sphere into 2 hemisphere and projected each seperately to give two circles. You can play Mathsteroids in stereographic projection mode here. Three spaceships travelling in straight lines on this projection are shown below.
)
... and if you still don't like map projections, you can still enjoy playing Mathsteroids on an old fashioned torus. Or on a Klein bottle or the real projective plane. Don't forget to take a short break from playing to head over to The Aperiodical and vote (voting now closed).
(Click on one of these icons to react to this blog post)
You might also enjoy...

Comments
Comments in green were written by me. Comments in blue were not written by me.
Add a Comment
This is true but it's not needed (it's automatically true), you have in fact already proved that this is a parallelogram, by proving that two opposite sides have same length and are parallel (If you prove that the vectors EF and GH have the same coordinates, then EFHG is a parallelogram.)